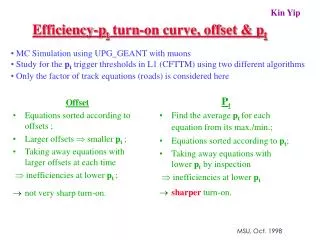
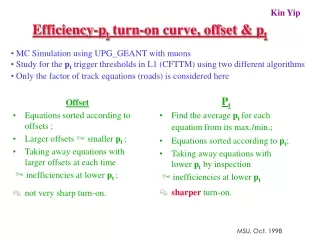
Download
1 / 9
90 likes | 315 Vues
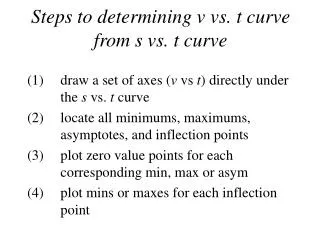
Steps to determining v vs. t curve from s vs. t curve. (1) draw a set of axes ( v vs t ) directly under the s vs. t curve (2) locate all minimums, maximums, asymptotes, and inflection points (3) plot zero value points for each corresponding min, max or asym

E N D
Steps to determining v vs. t curve from s vs. t curve (1) draw a set of axes (v vs t) directly under the s vs. t curve (2) locate all minimums, maximums, asymptotes, and inflection points (3) plot zero value points for each corresponding min, max or asym (4) plot mins or maxes for each inflection point
negative slope but flattening out start negative but get closer to zero
minimum = zero slope must cross time axis (i.e. v=0)
positive slope but becoming steeper Start at zero and increase
positive slope start out flat but becoming steeper slope stays + just not as steep slope stops becoming steeper and begins to flatten out This is known as an inflection point and corresponds to a local maximum on velocity vs. time curve
positive slope start out steep but becoming flatter slope flattens out as much as it is going to corresponds to a relative minimum then slope becomes steeper another inflection point
positive slope start out steep continues to become steeper
Region 1 – negative slope so negative velocity Region 2 – positive slope so positive velocity but inflection point where slope maxes out Region 3 – positive slope so positive velocity but inflection point where slope is minimized Region 4 – positive slope so positive velocity, no special points so velocity continues to rise
s v a max inf inf