Maximising Profits
170 likes | 348 Vues
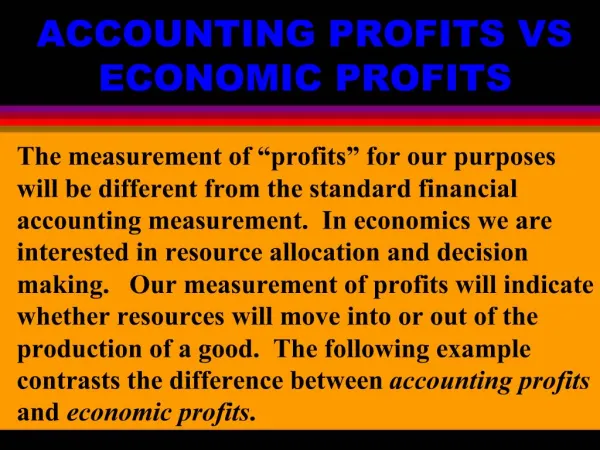
Maximising Profits. Maximising profits. We have seen how the cost curves of a firm were used to derive the supply curve. (Supply = MC > AVC) Firms operate under conditions influenced by diminishing returns in the short run. MC. =S. Costs($). Quantity.

Maximising Profits
E N D
Presentation Transcript
Maximising profits • We have seen how the cost curves of a firm were used to derive the supply curve. (Supply = MC > AVC) • Firms operate under conditions influenced by diminishing returns in the short run MC =S Costs($) Quantity
This graph shows two ways of how profit maximisation level of output for the firm can be established. First- using total revenue and total cost: Shows the firm maximising total profits where TR-TC is maximised. Second: Firm is maximising profits where MR=MC. For any output < Qe such as Q1 MR>MC the firm should increase output as it will make larger profits as long as MR>MC. (the extra revenue gained from selling the last unit of output > extra cost incurred in producing it.
Profit max where MR=MC • Producing an extra unit of output beyond Qe (such as Q2) will result in that unit of output adding more to total cost than it adds to total revenue MR<MC • Therefore total profit is maximised where MR=MC. Where the cost of producing an extra unit of output is equal to the additional revenue contributed by that unit of output. This occurs at Qe
Maximising Profits Example • Look at Q=2 • What is the associated MR? • MR=$10 • What is the associated MC? • MC=$5 • What action should the firm take to maximise profits? • Increase output as producing an extra unit of output with in MR>MC will add more to total revenue than it will add to MC and total profit will increase.
Maximising Profits example • Look at Q=4 • What is the associated MR? • MR=$10 • What is the associated MC? • MC=$15 • What action should the firm take? • Decrease output produced until MC=MR. As producing an extra unit of output where MC>MR will add more to total cost than it will add to total revenue and total profits will fall. The firm can reduce this loss by decreasing output.
Profit Maximising Level • Profit maximising level of output is where Q=? • Q=3 where MR=MC
Shut Down and Break Even Points • Break Even point is where AR=AC. The price is enough to cover all costs and the firm earns normal profits. Point a, P=$1.30 output=4000litres • Shut Down point is where P=AVC, P=$1.10 point b
Normal Profits • A firm will be earning normal profit when the revenue is sufficient to cover all the costs • AR=AC. • Remember the costs of production include • Rent, paid for land • Wages paid to labour • Interest paid to capital • Profit paid for enterprise MC AC AR Normal profit AR=AC
Subnormal Profit • Where the firms costs are greater than its revenue the firm is earning subnormal profits. • It is quiet possible for the firm to be earning accounting profits but because our opportunity costs may be high it may be making an economic loss MC AC AR
SUPERNORMAL PROFIT • Where the firms costs are greater than its revenue the firm is earning subnormal profits. • Only a Monopolist can sustain supernormal profits in the long run. • Perfect competitors will make normal profits in the long run, as other firms will easily enter the market, being attracted to the supernormal profits, thus increasing supply and resulting in normal profits MC AC AR
LONG Run • LONG RUN: This is the time frame when all inputs become variable. • In the Long run firms may enter an industry earning supernormal profits, while those earning a subnormal profit may leave the industry.
Interaction of firm and market in the long and short run MC What is the profit maximsing equilibrium output and price? 4 million litres, which can be sold at a market price of $200 per liter. At this level of output what is the AC? AC=$185 What does this mean for the type of profit being earned for this firm? The firm is able to earn supernormal profits of 600,000 ( profit per liter, .15c x 4million litres) AC MR=D The profit maximising level of output is where MC=MR. The MR for the perfectly competitive firm is determined by market price, which is shown by the intersection of the market demand and supply curves.
S S1 2.00 1.80 1.60 0 • In the short run firms cannot enter the market and therefore individual firms already in the market will be able to enjoy supernormal profits. • In the long run, there are no barriers to entry and exit from the market. The supernormal profits will attract other farmers to the dairy industry resulting in an increase in market supply. • Shown by increase in supply curve from S to S1 • Market price will be driven downwards until all supernormal profits have disappeared., which occurs at the price of 1.80 where AR=AC. • Long run equilibrium for perfectly competitive market is where all firms earn normal profits. AR=AC=MR=MC MR’ D Qe Q1
Interaction of firm and market in the long and short run MC AC What is the profit maximising level of output and price? MR=MC, 3 million liters, which it can sell at the market price of $1.60 per liter. What is the AC at this level of output? AC= $1.85 What does this mean for the profits earned by this firm? Firm is only able to make subnormal profits of $750,000 (25c subnormal profit x 3 million litres) MR=D=AR
MC AC S1 2.00 1.80 1.60 0 S MR D Q Q1 In the long run there are no barriers to entry or exit. This means that in the long run some farmers will be forced to leave the dairy industry due to the subnormal profits. This results in a decrease in market supply shown by a shift of the supply curve from S to S1. Market price will then be driven upwards until all subnormal profits have disappeared which occurs at the price of $1.80 where AC=AR In the long-run equilibrium will be where all firms earn normal profit, AR=AC=MR=MC
IN THE LONG RUN S MC • In the long run, a perfectly competitive firm will always be at break even where • AR=AC=MR=MC AR 2.00 1.80 1.60 0 MR=D Pe Long run equilibrium of the firm D 1000 2000 3000 4000 5000 6000 Qe