Download

1 / 30
300 likes | 459 Vues
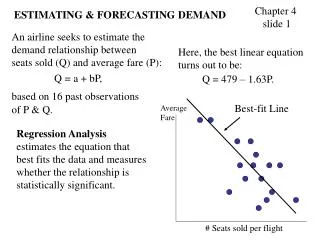
The reform of OTC derivatives is crucial for enhancing market stability and transparency. Following G20 commitments, the increased regulation of derivatives market participants has led to greater standardization, mandatory clearing, and margin requirements. As a result, there is an escalating demand for high-quality, liquid assets to serve as collateral. This report examines the interplay of regulatory reforms and market conditions, evaluating the repercussions on collateral demand and the supply of safe assets. A quantitative approach outlines initial margin estimates based on varying market scenarios.

E N D
OTC derivatives reform and estimating collateral demand ‘I think there is a world market for maybe five computers’ - Thomas Watson (1943), Chairman of IBM Che Sidanius Advisor Financial Stability
Regulatory reforms • G20 commitments • Increased regulation & supervision of derivatives market participants, including pension funds and insurance firms; • Greater standardisation of derivatives contracts; • Mandatory clearing through central counterparties (CCPs) • Margin requirements for bilateral contracts • Increased transparency (pre- and post-trade) and trade reporting • However, together with other regulatory reform... • Liquidity coverage ratio – promotes short-term funding • CCP default fund contributions (PFMI) • Basel III & Solvency II – increases need for high quality assets
OTC reforms: Demand vs supply impact • Direct impact channel: increased demand for high-quality, liquid assets • As collateral for OTCD transactions (cleared and non-cleared) • As liquid asset buffers (Basel III liquidity regulation) • As collateral in securities and repo lending (shadow banking) • Indirect impact channels: limitations on collateral velocity • Restrictions on collateral re-use/re-hypothecation (OTCD; shadow banking) • Greater use of account segregation (encouraged by regulation)
OTC reforms: Demand vs supply impact cont. Outstanding amounts of potentially safe assets (US$ trillions and percent in total) • Direct impact channel: supply of high-quality, liquid assets • AAA/AA government-securities outstanding: US$33 trillion (IMF) • However, significant amount held by CBs, long-term investors, or repo markets • Sovereign debt considered safe could fall by US$9 trillion by 2016 Source: IMF (2012)
OTC derivatives market – overview OTCD notional outstanding and world GDP ratio • $650 trillion in notional amount outstanding (BIS) • More than 10x world GDP • IRS – around 78% of OTCD market • Highly standardised • USD, EUR, Yen, GBP: 83% of notional value (FRBNY) • Mostly short-term tenor (<1 yr) • CDS – around 4% of OTCD market • USD, EUR: 98% of notional value (FRBNY) • Significant activity in 5 yr maturities Source: BIS, IMF and Bank calculations (2012)
OTC derivatives reforms: Estimating initial margin • Several studies; however, different scope, assumptions and methodologies
BoE quantitative approach • Objective: Consider methodology carefully when estimating collateral demand? • Netting • Rehypothecation • Market conditions • Our data sources: trade repositories & CCPs • Volume/value • Type of market participants • Margin models • Benefit: transparency, modifiable, replicable & provides a range
Quantitative estimates: our methodology Product scope: IRS & CDS (80% of total OTCD market) 1. Gross notional
Quantitative estimates cont: our methodology Product scope: IRS & CDS (80% of total OTCD market) 1. Gross notional 2. Netting ratio/proportion cleared
Quantitative estimates cont: our methodology Product scope: IRS & CDS (80% of total OTCD market) 1. Gross notional2. Netting ratio/proportion cleared 3. Apply VaR to estimate IM Ten-day VaR
Quantitative estimates cont: our methodology Gross notional in IRS TR data breakdown: • TriOptima for IRS: ~ 50% centrally cleared
Quantitative estimates cont: our methodology Gross notional in CDS Gross notional in IRS TR data breakdown: • TriOptima for IRS: ~ 56% centrally cleared • DTCC for CDS: ~ 10% centrally cleared
Quantitative estimates cont: our results for IRS & CDS Total IM : US$200-800 billion • 80% centrally cleared • Netting assumptions • Bilateral: no rehypothecation & 10-day VaR; Cleared: no rehypothecation & 5-day VaR
Quantitative estimates cont: results for IRS Total IM demand (US$ billions, ‘normal’ market conditions): netting matters
Quantitative estimates cont: results for CDS Total IM demand (US$ billions, ‘normal’ market conditions): Regulatory impact netting range
Effect of rehypothecation – IRS & CDS • Proposed rule would limit rehypothecation (IOSCO) CDS market IRS market
Effect of market conditions - methodology • Margin rates vary with market conditions • ‘Normal’ market conditions – avg. volatility during 2006 -2011 • ‘Tranquil’ market conditions – 2/3 of average volatility (e.g. January 2006) • ‘Stressed’ market conditions – 2x average volatility (e.g. October 2008)
Effect of market conditions: results for IRS & CDS • Under ‘stressed’ conditions - total IM for cleared and non-cleared may reach up to US$ 1.7 trillion • Haircuts applied to non-cash collateral CDS market IRS market
Pace of transition • Clearing obligation & margin rules for non-cleared contracts expected to affect new contracts • Pace of transition depends on maturity profile*
Final thoughts • Financial stability issues • OTCD reform benefits: • Counterparty credit risk • Transparency • Collateral demand vs supply; asset encumberance • Fragmentation of clearing, reduction of netting • Pro-cyclicality issues • Market response on-going • Compression, netting efficiencies, collateral transformation, cross-margining
References • OTCD reform and collateral demand impact (BOE): http://www.bankofengland.co.uk/publications/Pages/fsr/papers.aspx • Safe assets: financial system cornerstone (IMF): http://www.imf.org/external/pubs/ft/gfsr/2012/01/pdf/c3.pdf • An analysis of CDS transactions (FRBNY): http://www.newyorkfed.org/research/staff_reports/sr517.html • An analysis of OTC IRS derivatives transactions (FRBNY): http://www.newyorkfed.org/research/staff_reports/sr557.html