Download
1 / 17
170 likes | 342 Vues
Potato Variety Response to Phosphorus Fertilizer. Mike Thornton, Deron Beck, Jeff Stark and Bryan Hopkins. Petiole P status and yield are related. Y = 237 + 7.24X – 0.026 X 2. R 2 = 0.76. Source: Westermann and Kleinkopf, 1983. Daily uptake rate of P during three years at Aberdeen, ID.

E N D
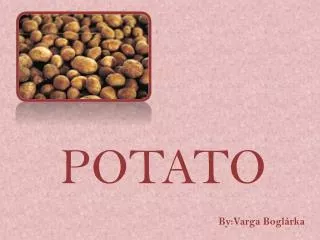
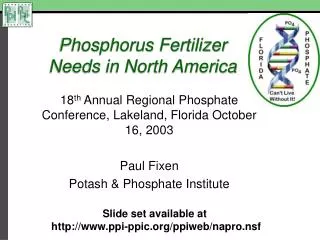
Potato Variety Response to Phosphorus Fertilizer Mike Thornton, Deron Beck, Jeff Stark and Bryan Hopkins
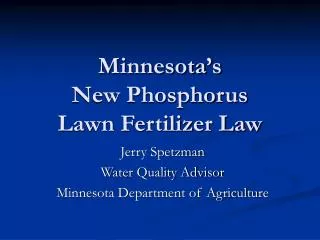
Petiole P status and yield are related Y = 237 + 7.24X – 0.026 X 2 R 2 = 0.76 Source: Westermann and Kleinkopf, 1983
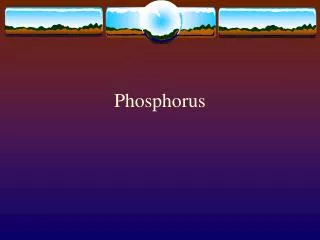
Daily uptake rate of P during three years at Aberdeen, ID Source: Stark, Westermann and Hopkins, 2004
Cultivar use in 2007 Washington Oregon Idaho Shepody
Do potato varieties differ in their response to P fertilizer? • Differences in yield response • Differences in P uptake or petiole levels • Differences in P removal by tubers • Varieties with poor root systems or susceptibility to early die might need more P
Methods • Split plot design with 4 rates of P2O5 (0,100, 200, 300 lbs per acre) broadcast as 11-52-0 and incorporated prior to planting. Urea used to balance N rates. • Four cultivars (Burbank, Ranger, Shepody, 6LS) planted as subplots Soil test values (0 to 12”) UI recommendation
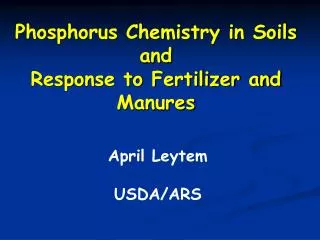
Influence of fertilizer rate on tuber size profile Russet Burbank 6 LS
Influence of fertilizer rate on petiole P concentration Deficient
SUMMARY Plant development was delayed and senescence increased at low P rates, especially in Shepody Petiole P levels were highest in Ranger, lowest in Russet Burbank and 6LS Ranger and 6LS had the strongest yield response to fertilizer P, and removed up to 33 lbs/acre P in tubers at harvest
For information about potatoes, visit: Idaho Center for Potato Research and Education http://www.ag.uidaho.edu/potato