Download
1 / 1
10 likes | 121 Vues
Brain Mapping of a Wavelet Analyses of Subjects with Obstructive Sleep Apnea. D. Belo 1 , A. Coito 1 , T. Paiva 2 , J.M. Sanches 1 1 Institute for Systems and Robotics / Instituto Superior Técnico, Lisboa, Portugal

E N D
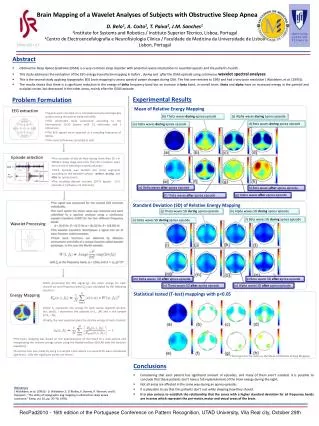
Brain Mapping of a Wavelet Analyses of Subjects with Obstructive Sleep Apnea D. Belo1, A. Coito1, T. Paiva2, J.M. Sanches1 1Institute for Systems and Robotics / Instituto Superior Técnico, Lisboa, Portugal 2Centro de Electroencefalografia e Neurofisiologia Clínica / Faculdade de Medicina da Universidade de Lisboa Lisbon, Portugal • Abstract • Obstructive Sleep Apnea Syndrome (OSAS) is a very common sleep disorder with potential severe implications in essential aspects and the patient's health; • This study addresses the evaluation of the EEG energy-based brain mapping in before , during and after the OSAS episode using continuous wavelet spectral analyses. • This is the second study applying topographic EEG brain mapping to assess spectral power changes during OSA. The first one remotes to 1993 and had a very poor resolution ( Walsleben, et al. (1993)); • The results shows that there is a significant reduction in the energy of deltafrequency band but an increase in beta band, in overall brain. theta and alpha have an increased energy in the parietal and occipital cortex, but decreased in the other areas, mainly after the OSAS episode. Experimental Results Problem Formulation Mean of Relative Energy Mapping (b) Theta waves during apnea episode (c) Alpha waves during apnea episode d) Beta waves during apnea episode (a) Delta waves during apnea episode EEG extraction (e) Delta waves after apnea episode h) Beta waves after apnea episode • Signals were recorded on a computerized polysomnography system during the patient sleep time (8h); • EEG electrodes were positioned according to the International 10-20 System with 21 electrodes and 2 references; • The EEG signals were acquired at a sampling frequency of 100 Hz. • The nasal airflow was recorded as well. (g) Alpha waves after apnea episode (f) Theta waves after apnea episode Standard Deviation (SD) of Relative Energy Mapping (j) Theta waves SD duringapnea episode (k) Alpha waves SD duringapnea episode l) Beta waves SD duringapnea episode (i) Delta waves SD during apnea episode Wavelet Processing Episode selection EEG • The cessation of the air flow during more than 10 s in NREM-2 sleep stage and more than 60 s isolation were the criteria of selecting an apnea episode; • Each episode was divided into three segments according to the episode's phase: before, during, and after an apnea event; • The resulting dataset includes 10773 epochs (171 episodes x 3 phases x 21 channels). Air Flow (m) Delta waves SD after apnea episode p) Beta waves SD after apnea episode • After processing the EEG signal (χ), the mean energy for each channel (c) and frequency band (fb) was calculated by the following equation: (n) Theta waves SD afterapnea episode (o) Alpha waves SD afterapnea episode Statistical tested (T-test) mappings with p<0.05 Energy Mapping • where Ep represents the energy for each apnea segment (p={pre, dur, post}), i represents the episode (i=1,...,M) and n the sample (n=1,...,N); • Finally, the next equation gives the relative energy of each channel: • The brain mapping was based on the approximation of the head to a semi-sphere and interpolating the channel energy values using the Matlab toolbox EEGLAB with the function topoplot(). • A second map was made by using a 2-sample t-test where a p-value<0.05 were considered significant. Only the significant points are shown. The lengend is the same as the Mean of Relative Energy Mapping • Conclusions • Considering that each patient has significant amount of episodes, and many of them aren't isolated, it is possible to conclude that these patients don't have a full replenishment of the brain energy during the night; • Not all areas are affected in the same way during an apnea episode; • It is plausible to say that this patients don't rest while sleeping how they should. • It is also curious to establish the relationship that the zones with a higher standard deviation for all frequency bands are in areas which represent the pre-motor, motor and visual areas of the brain. References ( Walsleben, et al. (1993)) - (J. Walsleben, E. O’Malley, K. Bonnet, R. Norman, and D. Rapoport, “The utility of topographic eeg mapping in obstructive sleep apnea syndrome,” Sleep, vol. 16, pp. 76–78, 1993) RecPad2010 - 16th edition of the Portuguese Conference on Pattern Recognition, UTAD University, Vila Real city, October 29th


