Identifying Data Flows
350 likes | 373 Vues
Learn how to create Data Flow Diagrams (DFDs) to identify and visualize data flows within a system. Understand where data originates, how it is processed, stored, and distributed.

Identifying Data Flows
E N D
Presentation Transcript
Identifying Data Flows • During the analysis stage of a project it is important to find out how data flows through a system: • Where does the data originate • What processing is performed on it and by whom • Who uses the data • What data is stored and where • What output is produced and who receives it
DATA FLOW DIAGRAMS [DFD’S] • A diagram to show how data is captured, processed , stored and distributed within a system. • This is generally represented during the analysis stage of a project, but can be further refined during the design stage to show more detail of how the system functions.
PROCESS • DATA FLOW SYMBOLS USED IN A DFD Actions performed on data so that they are transformed, stored or distributed. This can be a computerised or manual transformation E.g. Result of a query to a database, contents of a printed report : data that moves together to common destinations
DATA STORE • SOURCE/SINK SYMBOLS USED IN A DFD A physical location to hold data e.g. a file folder or notebook etc. Origin and/or destination of the data. Often referred to as external entities as they are outside the system. We are only interested in how data flows in to or from the system to them.
How Much Detail ? • It is often impossible to represent a complete business on one diagram. For this reason it is quite common to use more than one level of Data Flow Diagram with each level showing more detailed information about part of the previous diagram. • It is important that the diagram should be made as clear as possible and for this reason it is not uncommon to draw the same source or sink [external entity] more than once to help achieve this.
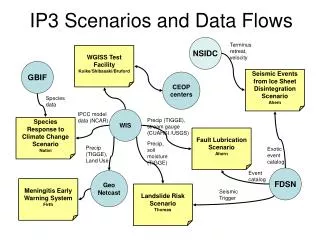
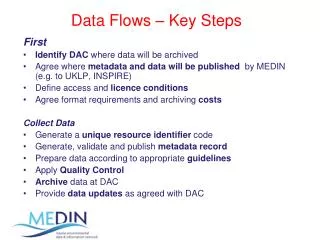
Context or Level 0 Diagram The highest level view of a system. This only has one process which represents the overall function of the system and has no data stores as all the data is stored within the process. • Main steps when constructing a Level 0 Diagram : • Identify where data is captured from • Identify where data is distributed to • Describe the overall process • Map these out in a diagram using the correct symbols • Link them with data flows that are labelled
Constructing a Level 1 diagram • Identify and draw the processes that make up the Level 0 process • Allocate descriptions to these • Lay out the sources/sinks and data flows from the Level 0 diagram • Draw in any data stores used in the process • Link the new processes and data stores with named data links
Constructing a Level 2/3 diagram IF it is necessary to produce a level 2 or level 3 diagram, the same steps would be followed as used when constructing the Level 1 diagram
Here is an example of how Data flow diagrams would be used to model the logic of data flows in a fast food burger bar. • . Context or Level 0 Diagram • Identify where data is captured from • Identify where data is distributed to • Describe the overall process • Map these out in a diagram using the correct symbols • Link them with data flows that are labelled
CUSTOMER Level 0 Context diagram
Identify where data is captured from • Identify where data is distributed to • Describe the overall process • Map these out in a diagram using the correct symbols • Link them with data flows that are labelled
KITCHEN RESTAURANT MANAGER Level 0 Context diagram CUSTOMER
Identify where data is captured from • Identify where data is distributed to • Describe the overall process • Map these out in a diagram using the correct symbols • Link them with data flows that are labelled
0 Food ordering system Level 0 Context diagram CUSTOMER KITCHEN RESTAURANT MANAGER
Identify where data is captured from • Identify where data is distributed to • Describe the overall process • Map these out using the correct symbols • Link them with data flows that are labelled
Customer Order Food Order Receipt Management Reports Level 0 Context diagram CUSTOMER KITCHEN 0 Food ordering system RESTAURANT MANAGER
Constructing a Level 1 diagram • Identify and draw the processes that make up the Level 0 process • Allocate descriptions to these • Lay out the sources/sinks and data flows from the Level 0 diagram • Draw in any data stores used in the process • Link the new processes and data stores with named data links
Does this show enough detail? Level 0 Context diagram CUSTOMER KITCHEN 0 Customer Order Food ordering system Food Order Receipt Management Reports RESTAURANT MANAGER
Constructing a Level 1 diagram • Identify and draw the processes that make up the Level 0 process • Allocate descriptions to these • Lay out the sources/sinks and data flows from the Level 0 diagram • Draw in any data stores used in the process • Link the new processes and data stores with named data links
Level 1 diagram • These new processes may show a process which corresponds to actions such as : • Capturing data from different sources • Maintaining data stores • Producing and distributing data to different sinks
1.0 Receive and transform Customer Food Order
Level 1 diagram • These may show a process which corresponds to actions such as : • Capturing data from different sources • Maintaining data stores • Producing and distributing data to different sinks
1.0 Receive and transform Customer Food Order 3.0 2.0 Update Inventory file Update Goods Sold file
Level 1 diagram • These may show a process which corresponds to actions such as : • Capturing data from different sources • Maintaining data stores • Producing and distributing data to different sinks
1.0 Receive and transform Customer Food Order 3.0 2.0 Update Inventory file Update Goods Sold file 4.0 Produce Management Reports
Constructing a Level 1 diagram • Identify and draw the processes that make up the Level 0 process • Allocate descriptions to these • Lay out the sources/sinks and data flows from the Level 0 diagram • Draw in any data stores used in the process • Link the new processes and data stores with named data links
1.0 Customer Order Receive and transform Customer Food Order Food Order CUSTOMER Receipt KITCHEN 3.0 2.0 Update Inventory file Update Goods Sold file 4.0 Produce Management Reports RESTAURANT MANAGER Management Reports
Constructing a Level 1 diagram • Identify and draw the processes that make up the Level 0 process • Allocate descriptions to these • Lay out the sources/sinks and data flows from the Level 0 diagram • Draw in any data stores used in the process • Link the new processes and data stores with named data links
1.0 Receive and transform Customer Food Order CUSTOMER KITCHEN 3.0 2.0 Update Inventory file Update Goods Sold file D2 Inventory File Goods Sold File D1 4.0 Produce Management Reports Customer Order Food Order Receipt RESTAURANT MANAGER Management Reports
Constructing a Level 1 diagram • Identify and draw the processes that make up the Level 0 process • Allocate descriptions to these • Lay out the sources/sinks and data flows from the Level 0 diagram • Draw in any data stores used in the process • Link the new processes and data stores with named data links
1.0 Receive and transform Customer Food Order CUSTOMER KITCHEN Inventory Data Goods Sold 3.0 2.0 Update Inventory file Inventory Data Update Goods Sold file Goods Sold Data D2 Inventory File Goods Sold File D1 4.0 Produce Management Reports Daily Inventory Depletion Amounts Daily Goods Sold Amount Customer Order Food Order Receipt RESTAURANT MANAGER Management Reports
In this example, having constructed our Level 1 diagram it is decided there is no need to further breakdown the data flow processes within this organisation. Our data flow diagram is therefore complete.
Do’s and Don’ts when constructing a Data Flow Diagram
Do’s and Don’ts when constructing a Data Flow Diagram
Do’s and Don’ts when constructing a Data Flow Diagram