COST VOLUME PROVIT (CVP) ANALYSIS
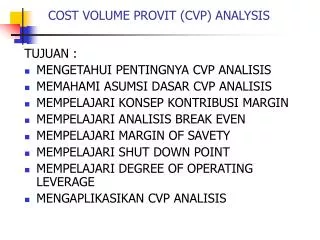
COST VOLUME PROVIT (CVP) ANALYSIS. TUJUAN : MENGETAHUI PENTINGNYA CVP ANALISIS MEMAHAMI ASUMSI DASAR CVP ANALISIS MEMPELAJARI KONSEP KONTRIBUSI MARGIN MEMPELAJARI ANALISIS BREAK EVEN MEMPELAJARI MARGIN OF SAVETY MEMPELAJARI SHUT DOWN POINT MEMPELAJARI DEGREE OF OPERATING LEVERAGE

COST VOLUME PROVIT (CVP) ANALYSIS
E N D
Presentation Transcript
COST VOLUME PROVIT (CVP) ANALYSIS TUJUAN : • MENGETAHUI PENTINGNYA CVP ANALISIS • MEMAHAMI ASUMSI DASAR CVP ANALISIS • MEMPELAJARI KONSEP KONTRIBUSI MARGIN • MEMPELAJARI ANALISIS BREAK EVEN • MEMPELAJARI MARGIN OF SAVETY • MEMPELAJARI SHUT DOWN POINT • MEMPELAJARI DEGREE OF OPERATING LEVERAGE • MENGAPLIKASIKAN CVP ANALISIS
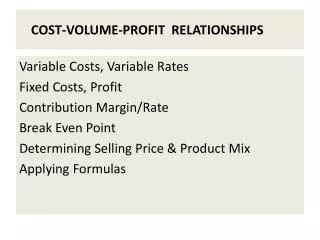
CVP analisis untuk menjawab pertanyaan sbb : • Berapa unit harus terjual untuk mencapai target laba perusahaan • Apa pengaruh penurunan harga jual tiap unit terjual thd laba • Apakah dg penambahan mesin baru akan meningkatkan laba • Apakah dg pemasaran yang tinggi dpt meningkatkan laba • Berapa laba dpt diperoleh dari produk baru
Variable Costs Fixed Costs Total Fixed Costs Total Variable Costs Total Costs Total Costs Total Units Produced Total Units Produced Unit Fixed Costs Unit Variable Costs Per Unit Cost Per Unit Cost Total Units Produced Total Units Produced
PENTINGNYA CVP ANALISIS untuk menentukan harga jual per unit untuk memilih bauran produk yang dijual untuk menentukan strategi pemasaran yang baik untuk mengevaluasi dampak keuntungan terhadap perubahan biaya
ASSUMPTIONS IN CVP total pendapatan bersifat linier (% perubahan pendapatan = % perubahan volume penjualan) biaya dapat dipisahkan menjadi biaya tetap dan biaya variabel Efisiensi dan produktifitas konsisten
CONSEPTS IN CVP Example : perusahaan sepatu menjual 5,000 units sepatu per bulan Sales price : $20 / unit Variable cost : $ 12 / unit Fixed cost : 40,000 per bulan
MARGINAL INCOME STATEMENT Total Sales (5,000 x 20) $100,000 Variable cost (5000 x 12) 60,000 Contribution Margin $ 40,000 Fixed cost 40,000 Operational Profit $ 0 Variable cost Contribution Margin: The balance which available to cover the fixed cost of the company Sales Fixed cost Profit
MARGINAL INCOME STATEMENT Total Per unit % Sales (5,000 x 20) $100,000 $ 20 100 Variable cost (5000 x 12) 60,000 12 60 Contribution Margin $ 40,000 8 40 Fixed cost 40,000 Operational Profit $ 0 Operational profit Variable cost Fixed cost Sales = + + Total Contribution Margin Total Sales Variable cost – = Variable cost per unit Contribution Margin per unit Sales price per unit = –
BREAK- EVEN POINT (TITIK PULANG MODAL) BEP/TPM : titik dimana perusahaan tidak mendapat laba atau tidak mengalami kerugian Total revenue = Total cost (Variable cost+ fixed cost) Total contribution margin = Total fixed cost
BREAK-EVEN POINT /TPM Contribution Margin approach Contribution Margin /unit (CM) = Sales price/unit – variable cost/ unit = $20 - $12 = $8 / unit BEP /TPM (unit) : Total CM = Total fixed cost CM/unit x Q = 40,000 8Q = 40,000 8Q = 40,000 / 8 = 5,000 units
BREAK EVEN POINT/TPM Contribution margin approach % CM = CM per unit / Sales Price per unit = (8 / 20) x 100 = 0.4 @ 40% BEP/TPM ($/Rp) : % CM from revenue = Total fixed cost 40% from revenue = 40,000 40% X revenue = 40,000 Revenue = 40,000 / 40% = $100,000
BREAK-EVEN POINT (TPM) Summary CM per unit = Sales price/unit – Variable cost/unit Percentage CM = CM X 100 Sales BEP/TPM (unit) = Total fixed cost / CM per unit BEP/TPM ($/Rp) = Total fixed cost/ % CM per unit
CVP APPLICATION– DETERMINE THE PROFIT perusahaan menargetkan laba penjualan sepatu $30,000. berapa pasang sepatu harus dijual(unit) ? Unit sales = Total fixed cost + targeted profit CM/unit = (40,000 + 30,000) / 8 = 70,000 / 8 = 8,750 units
CVP APPLICATION– DETERMINE THE PROFIT perusahaan menargetkan laba $ 30,000. berapa tingkat penjualan perusahaan ($) ? Sales ($) = (Total fixed cost + Targeted profit) %CM = (40,000 + 30,000)/40% = 70,000 / 40% = 70,000/0.4 = $ 175,000
CVP APPLICATION– CHANGES IN FIXED COST bila perusahaan menaikkan biaya tetap $ 4,000. informasi lain tidak berubah. Tentukan nilai BEP yang baru • BEP (unit) : = Total fixed cost/CM per unit • = (40,000 + 4,000)/8 • = 44,000/8 • = 5,500 units • BEP($) : = Total fixed cost/%CM per unit • = (40,000 + 4,000)/40% • = 44,000 / 0.4 • = $110,000
CVP APPLICATION – CHANGES IN CM jika biaya variabel per unit naik dari $12 menjadi $16. Total biaya tetap $40,000. tentukan BEP yang baru • CM per unit = Sales price – Variable cost/unit • (new) = $20 - 16 • = $4 • %CM per unit = (CM/ unit / S. P/ unit) x 100 • = (4/20) x 100 • = 20%
CVP APPLICATION – CHANGES IN CM jika biaya variabel per unit naik dari $12 menjadi $16. Total biaya tetap $40,000. tentukan BEP yang baru • BEP (unit) = Total fixed cost/CM per unit • = 40,000 / 4 • = 10,000 units • BEP($) = Total fixed cost/% MS = 40,000 / 20% • = 40,000 / 0.2 • = $200,000
CVP APPLICATION – CHANGES IN CM jika perusahaan menaikkan harga jual $3. biaya tetap dan biaya variabel tidak berubah. Hitunglah titik BEP • CM per unit = Sales price – Variable cost/unit • = ($20 +3) - 16 • = $7 • % CM = CM per unit /SP per unit • = 7/23 • = 30.4%
CVP APPLICATION – CHANGES IN CM jika perusahaan menaikkan harga jual $3. biaya tetap dan biaya variabel tidak berubah. Hitunglah titik BEP BEP (unit) = Total fixed cost / CM per unit = 40,000 / 7 = 5,715 units BEP ($) = Total fixed cost/ % CM = 40,000/30.4% = 40,000/0.304 = $131,579
MARGIN OF SAFETY • selisih antara penjualan yang dicapai dengan penjualan pada titik BEP • jika pada tahun ini penjualan perusahaan mencapai 8,000 units (harga jual, biaya tetap, biaya variabel tidak berubah. Hitunglah besar margin of safety. Margin of safety (unit) = penjualan – penjualan BEP = 8,000 – 5,000 = 3,000 unit @ 3,000 x Sales price 3,000 x 20 = $60,000
Grafik hubungan CVP • Tyson company dg data sbb: • FC = $15 • VC/ unit = $ 12 • P/unit = $20
SHUT DOWN POINT ( TITIK PENUTUPAN USAHA) • Mempertimbangkan • Pendapatan penjualan • Biaya tunai ( cash cost / out of pocket costs) • RUMUS: SDP = BIAYA TETAP TUNAI/ CM RATIO
SDP = BIAYA TETAP TUNAI /CM = 64.500.000/(172.000-43.000) = 500 Kg ATAU SDP = 64.500.000/ 75 % = Rp 86.000.000
DEGREE OF OPERATING LEVERAGE • Memberikan ukuran dampak perubahan pendapatan penjualan terhadap laba bersih Degree of operating Leverage 21x
MULTIPLE BREAKEVEN POINT • Contoh : Whittier company memutuskan memproduksi 2 model mesin pemotong rumput dg rincian sbb
MULTIPLE BREAKEVEN POINT Proyeksi laporan laba rugi berdasar ramalan/proyeksi penjualan:
MULTIPLE BREAKEVEN POINT- penentuan bauran produk dan analisis CVP • Apabila whittier co. berencana menjual 1.200 mesin manual dan 800 mesin otomatis maka bauran penjualan adalah 1.200 : 800 = 3 : 2 • a3 x $ 75 • b2 x $ 200
MULTIPLE BREAKEVEN POINT- penentuan bauran produk dan analisis CVP • Paket BEP = biaya tetap/MC per paket = $ 96.250 /$ 625 = 154 paket
CVP BERDASARKAN AKTIVITAS ( ABC) Total biaya ABC = biaya tetap + ( biaya variabel per unit x jumlah unit) + ( biaya tingkat batch x penggerak batch) + (biaya tingkat produk x penggerak produk) BEP (unit) ABC = Biaya tetap +( biaya tingkat batch x penggerak batch) + biaya tingkat produk x penggerak produk harga – biaya variabel per unit
CVP BERDASARKAN AKTIVITAS ( ABC) • Dory manufacturing memproduksi kaos dg logo berbagai tim olah raga. Setiap kaos dikenakan harga $ 10. rincian biaya sbb:
CVP BERDASARKAN AKTIVITAS ( ABC) Jika biaya tetap sbb : • Biaya tetap ( ABC) $ 50.000 • biaya tetap ( konvensional) $ 96.000 BEP berdasarkan aktivitas : BEP (unit) = $ 50.000+( 450 x 80) + (20 x 500) $ 10 - $ 5 = 19.200 unit
CVP BERDASARKAN AKTIVITAS ( ABC) • Misalkan Dory mampu mengurangi biaya setup sebesar $ 150 per setup dan jumlah jam mesin menjadi $425 per setup. Maka titik impas sbb: BEP (unit) = $ 50.000+( 300 x 80) + (20 x 425) $ 10 - $ 5 = 82.500 unit $ 5 = 16.500 unit
Latihan cost volume profit Henderson bottling Company memproduksi dan menjual kola generik kepada pengecer. Kola tersebut dimasukkan dalam botol plastic 2 liter dan dijual kepada pengecer dengan harga $1,00 per botol. Biaya variabel per botol adalah sebagai berikut: Komposisi kola $ 0,45 Botol dan tutup 0,10 Penjualan 0,17 Total biaya manufaktur tetap adalah $22.000 per tahun. Total biaya administrasi (seluruhnya tetap) adalah $6.000. Diminta: • Hitunglah jumlah botol kola yang harus dijual Henderson agar mencapai titik impas. • Berapa botol kola yang harus dijual Henderson agar menghasilkan laba sebelum pajak $ 12.600? • Dengan asumsi tariff pajak 40 %, berapa botol kola yang harus dijual Henderson untuk menghasilkan laba setelah pajak sebesar $25.200? • Misalkan Henderson berharap menjual 115 botol kola, berapakah marjin pengaman dalam botol ? dalam dolar?
Latihan cost volume profit • Lacy company memproduksi dua produk. Untuk tahun yang akan dating, lacy berharap dapat menjual 1.000 unit produk A dan 3.000 unit produk B. Laporan laba rugi yang dianggarkan untuk tahun berikutnya adalah sebagai berikut. Diminta: • Berapakah bauran penjualan lacy company? • Hitunglah jumlah unit produk A dan B yang harus dijual lacy agar mencapai titik impas? • Tanpa membuat paket, hitunglah pendapatan titik impas lacy company ?
Latihan cost volume profit • Halligan company telah menyusun laporan rugi –laba berikut untuk tahun berjalan Diminta: • Berapakah marjin pengaman dalam dolar penjualan? Dalam unit? • Berapakah tingkat leverage operasi Halligan company?
Latihan cost volume profit Gernon company memproduksi kalkulator ilmiah dan bisnis. Untuk tahun yang akan datang, gernon berharap menjual 20.000 kalkulator ilmiah dan 100.000 kalkulator bisnis. Laporan laba-rugi segmen untuk masing-masing produk adalah sebagai berikut: Diminta : • Hitunglah jumlah kalkulator ilmiah dan bisnis yang harus dijual agar mencapai titik impas. • Dengan hanya menggunakan informasi dari kolom “total” pada laporan rugi laba tersebut, hitunglah pendapatan penjualan yang harus dihasilkan perusahan untuk mencapai titik impas