Download
1 / 25
250 likes | 560 Vues
Well Water Quality: Analysis and Assessment of Well Water Quality in City of San Jose. Michel Benin Walden University PUBH 8165 Dr. Raymond THron. Objectives. Explain the chemistry, biology and microbiology of water, including water quality standards

E N D
Well Water Quality: Analysis and Assessment of Well Water Quality in City of San Jose Michel Benin Walden University PUBH 8165 Dr. Raymond THron
Objectives • Explain the chemistry, biology and microbiology of water, including water quality standards • Discuss who is San Jose Municipal Water System its service areas, and well water sources • Understand public water supply requirements and measurements • Understand well water quality standards in the City of San Jose, including disinfection methods • Explore issues and future challenge of San Jose Municipal Water System
I. Watera.Chemistry • Raw waters has pH of < 7.0 , natural acidity due to natural constituents, i.e. dissolved carbon dioxide or organic acids • Some treatment processes for example coagulation with aluminum or iron sulfate can lower the pH of water • Main criteria in for water guidelines and standards is to adjust pH value to achieve a non corrosive water supply • Water contains many inorganic chemicals like aluminum, ammonia, calcium, chloride, etc Reference: Twort, et al. (2000). Water Supply. Great Britain: Arnold Publishers
I. Waterb. Biology • The organic matter in water can come from a number of sources including plant, animal material, domestic and commercial effluents. • The many tastes and odors of water can come from natural contaminants or agricultural and industrial discharges • The turbidity of water determines condition of the water Reference: Twort, et al. (2000). Water Supply. Great Britain: Arnold Publishers
I. Waterc. Microbiology • Water can support growth of various microorganisms. • Many microorganisms are found naturally in fresh and saltwater. • The various organisms like bacteria, cyanobacteria, protozoa, algae, and tiny animals such as rotifers. • The various organism present in water can cause serious health effects on humans. Reference: Water Microbiology Retrieved from http://science.jrank.org/pages/7311/Water-Microbiology.html#ixzz0LaKXnjX7
II. Watere. Water Quality Standards • The various water quality standards being used today are as follows: • The World Health Organization’s “ Guidelines for Drinking Water Quality 2003” , amendments and various editions. • The European Commission Directive on the “Quality of Water Intended for Human Consumption 1998” • U.S Environmental Protection Agency, National primary Drinking water Regulations, 1986 Amendments to the Safe Drinking Water Act Reference: Gilbert, C and Calabrese, E. (1992). Regulating Drinking Water Quality. Michigan: Lewis Publishers.
II. Watere. Water Quality Standards cont. • Health concerns regarding water quality prompted the 1986 passage of the Safe Drinking Water Act (SDWA) of 1974. • A number of amendments to the SDWA act included 1988 Lead Contamination Control Act, promulgation of surface water treatment rule, groundwater disinfection requirements, 1989 total coliform rule and the new maximum contaminant rule for radon Reference: Gilbert, C and Calabrese, E. (1992). Regulating drinking water quality. Michigan: Lewis Publishers
II. Watere. Water Quality Standards: LEAD • Lead in drinking water comes from raw water supplies and dissolution of lead bearing materials from distribution systems and private structure plumbing. • The current regulation for lead are as follows: • Maximum Contaminant Level Goal of zero. • Treatment technologies are reducing lead in source water, reducing corrosiveness of water, removing lead from distribution system and plumbing, and implementation of public education Reference: Gilbert, C and Calabrese, E. (1992). Regulating drinking water quality. Michigan: Lewis Publishers
II. Watere. Water Quality Standards: RADON • Levels of radon in water is a significant health concern, causing an EPA estimate of 8,000 to 40,000 lung cancer cases. • Radon in water comes from soil that goes to groundwater. • National water surveys showed that radon levels in groundwater is 900 pCi/L. • Current EPA radon standard is 300 pCi/L as technically achievable level. A Reference: Gilbert, C and Calabrese, E. (1992). Regulating drinking water quality. Michigan: Lewis Publishers
II. Watere. Water Quality Standards: Microbial Contamination • Microbial contamination in water significantly pose a health risk. • Under the regulation, the disinfection requirements for microbial contamination are: • State specific design and operating conditions. • State specifies design and operating conditions to meet standard minimum level of inactivation • State responsible for monitoring and enforcing criteria. Reference: Gilbert, C and Calabrese, E. (1992). Regulating drinking water quality. Michigan: Lewis Publishers
III. San Jose Municipal Water Systema. Who • The San Jose Municipal Water System supplies water to the City of San Jose, located easterly of Santa Clara Valley • The city spreads over 173 square miles, with an estimated population of 1,000,000. • This is the 3rd largest city on the West Coast, and 11th largest in the U.S.. • Water comes from watershed in Santa Clara, which consists of lands, reservoir, rivers, streams, creeks and groundwater recharge areas and distribution and treatment facilities • The city has a semi-arid Mediterranean type of climate Reference: City of San Jose. (1996). Water Policy Framework. Retrieved on July 15, 2009 from www.sjmuniwater.com
III. San Jose Municipal Water Systema. Who continuation • Thee City of San Jose receives 14 to 15 inches of rainfall per year. Normal rainfall years provides 50% of the city’s water supply. • The three major groundwater basins are Santa Clara, Coyote and Llagas Valley. • The city owns the San Jose Municipal Water System. • The supply of potable water in the City is determined by annual rainfall. Storage capacity for snow pack runoff, contractual arrangements between water wholesalers and suppliers, prevailing contractual rights Reference: City of San Jose. (1996). Water Policy Framework. Retrieved on July 15, 2009 from www.sjmuniwater.com
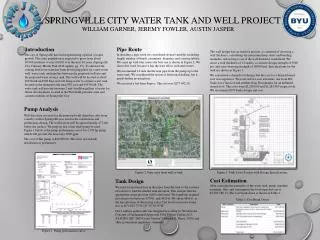
III. San Jose Municipal Water Systemb. Service Areas • The San Jose Municipal Water System service areas can be located at this link • www.sjmuniwater.com/PDFs/MuniWaterServiceAreaMap_3-13-09.pdf - 2009-03-13 -
III. San Jose Municipal Water Systemc. Water Sources • The water sources for the city is based on three service areas • Evergreen- water source comes from Santa Clara Valley Water District, which comes from South Bay aqueduct, Lake Del Valle and San Luis Reservoir. District local water comes from Anderson and Calero Reservoirs • North San Jose/Alviso – water comes from water purchased from Hetchy Hetcy water and treated water from san Francisco Public Utilities Commission. Also supplemented by local watersheds from Alameda and Santa Clara counties. • Edenvale and Coyote Valley – water comes from deep wells. Water quality from these wells monitored by Santa Clara Valley Water District. Reference: City of San Jose. (1997). Study Session on Water Issues. Retrieved on July 15, 2009 from www.sjmuniwater.com
III. San Jose Municipal Water Systemd. Water Quality • The city adopted USEPA and CDHS Best Available Technologies for reducing MCLs. • Based from the analysis, the constituents that had levels above PHG, no PHG or above PHG are lead and copper – in 2004 the 90th percentile for lead was 0.003 mg/l, 90th percentile for copper was 0.41 mg/dl. All these values still within State regulatory requirements. Radon levels are within regulatory requirements • All parameter of inorganic chemicals, organic microbiological are all within regulatory standards. • Secondary drinking water parameters are also within regulatory standards. • Other parameters like boron, hardness , calcium, etc are within the regulatory standards Reference: City of San Jose. (2008). Water Quality. Retrieved on July 15, 20009 from www.sjmuniwater.com
IV. Public Water Supply and Requirements • Categories of Consumption • Levels of consumption • Price and its effects on water demand • Growth trends and forecasting demands • Demand constraints methods
IV. Public Water Supply and Requirementsa. Categories of consumption • Domestic – consumption category that includes drinking, cooking, laundry, gardening, etc. • Trade and Industrial- consumption category that includes factories, restaurants, airports, government offices, hospitals, etc • Agricultural -consumption category that includes crops and livestock farming, dairies, farms, etc. • Public -consumption category that includes street cleaning, public parks maintenance, sewer flushing, etc • Losses -consumption category that includes leaks from valves, misuse of water by consumers, supply meter errors, unauthorized consumption, etc. Reference: Twort, et al. (2000). Water Supply. Great Britain: Arnold Publishers
IV. Public Water Supply and Requirementsb. Levels of Consumption • An acre foot (AF) is the standard of water consumption measurement used in most public water management companies including the City of San Jose • US gallon unit of volume is used for daily water operations • One Hundred Cubic Feet (either CCF or HCF) is the volume unit measurement used by most water retailers to quantify a home’s monthly water usage • In 2007, approximately 400,000 acre-feet (357 MGD) of potable water was consumed by residents and commercial establishments in San Jose. • In San Jose, the average monthly water usage per household was 15 CCF (11,220 gallons or .3 AF) and with an average cost of $43 per month. Reference: City of San Jose. (1996). Water Policy Framework. Retrieved on July 15, 2009 from www.sjmuniwater.com
IV. Public Water Supply and Requirementsc. Price and its effects on water demand • San Jose Municipal Water purchases wholesale their water supply from San Francisco since 1984 • The Water Supply Agreement between the two cities include: • Agreement for 25 years from July 1, 2009 to June 30, 2034. • Supply assurance of 184 million gallons per day • San Francisco commits to water efficiency programs and water quality standards • The elasticity of the demand for water in San Jose, which affects the city’s budget for water is mainly driven by proposed development projects in the North San Jose, Evergreen East Hills projects • San Jose Municipal Water is expected to apply for three years a rate increase of 4.5% annually among residential and commercial establishments Reference: City of San Jose. (1997). Study Session on Water Issues. Retrieved on July 15, 2009 from www.sjmuniwater.com
IV. Public Water Supply Requirementsd. Growth Trends and forecasting demands • Current and estimated growth projections for San Jose Municipal Water service area from 2005, 935,000 to 1.5 million in 2040. • Based from estimated growth of built in 25,000 homes with a demand assumption of 300 gallons per day, the water demand will be approximately 8400 AF/year • Based from estimated increase in 50,000 in jobs with a demand assumption of 70 gallons per day per employee, the water demand will be approximate 4000 AF/year • This results to 21,300 acre-feet per year demand increase that represents 14% of the current San Jose Municipal Water supply. Reference: City of San Jose. (1997). Study Session on Water Issues. Retrieved on July 15, 2009 from www.sjmuniwater.com
IV. Public Water Supply Requirementse. Demand Constraints Methods • Since California is experiencing its third year of drought, the City of San Jose is implementing a community wide water reduction program of 15% • The city provided its customers Water Usage Guidelines Program to determine how much water can be used every month to meet the 15% reduction in water target Reference: City of San Jose. (2008). Water Usage Guideline. Retrieved on July 15, 2009 from www.sjmuniwater.com
IV. Public Water Supply Requirementse. Demand Constraints Methods cont. • The important components of the guidelines are: • Establish a baseline flow – provide flow balance diagram to show water processes and activities in residential, commercial facilities. • Identify high water use areas – calculate total influent liquid flow rate, which includes all sources and the rate of flow of liquid chemicals used for various purposes greater or equal to 1,000 gpd. • Complete a water balance – the total of all effluent flow streams leaving the facility Reference: City of San Jose (2009). Water Usage Guidelines. Retrieved on July 15, 2009 from www.sjmuniwater.com
IV. Public Water Supply Requirementse. Demand Constraints Methods • Based from the water usage guidelines results, the city recommends the following: • Idle flow rate reduction • High efficiency reverse osmosis system • Replace toilets and urinals with low flow units • Retrofit and replace faucets and shower heads with low flow units • Replace pump and packing seals • Install irrigation flow constraints Reference: City of San Jose. (2009). Water Usage Guidelines. Retrieved on July 15, 2009 from www.sjmuniwater.com
V. San Jose Municipal Water System:Issues and Future Challenges • Major issue due to population growth is by 2030 need an additional 125,000 acre feet of water • Need to meet conservation goal of 100,000 acre feet per year • Implementation of existing programs and new technologies • Budget • Environmental change Reference: City of San Jose. (1996). Water Policy Framework. Retrieved on July 15, 2009 from www.sjmuniwater.com