Download
1 / 23
230 likes | 355 Vues
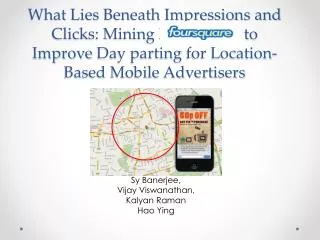
What Lies Beneath Impressions and Clicks: Mining Foursquare to Improve Day parting for Location-Based Mobile Advertisers. Sy Banerjee, Vijay Viswanathan , Kalyan Raman Hao Ying. Location Based Mobile Advertising. According to e Marketer, LBA is a rising star. The Problem.

E N D
What Lies Beneath Impressions and Clicks: Mining Foursquare to Improve Day parting for Location-Based Mobile Advertisers Sy Banerjee, Vijay Viswanathan, Kalyan Raman Hao Ying
Location Based Mobile Advertising • According to e Marketer, LBA is a rising star
The Problem “However, as I looked at Sense’s list of the “top 50 brands with the biggest retail retargeting opportunity in mobile,” I noticed a problem — although I’m almost always within the presence of one of them, I only frequent a few of them. While I always seem to find myself nearby a Subway (ranked highly on Sense’s list because of its omnipresent nature, presumably), I can’t imagine the company could place an ad on Angry Birds good enough to lure me inside.”
LBA LBA is more effective than standard mobile advertisements due to the added relevance by geographical proximity (Jagoe2003; Unni and Harmon, 2007). But context affects the effectiveness of LBA. Specifically Location –Public/Private (Banerjee & Dholakia, 2008) Task Situation-Work/Leisure(Banerjee & Dholakia, 2008) Audience Gender (Banerjee & Dholakia, 2012) Can we time/schedule ads to reach consumers when engaged in different activities? How do we find out what who is doing, and when?
Why Day part? Right Audience + Right Time = AD RELEVANCE • +
Day parting Goals by Media • TV: DV: Viewer Engagement • Internet: DV: Clicks, Purchases, Click through rates
How to Make LBA more Relevant? Goal of LBA : To bring people physically to the store In a place like Times Square, where there are so many things to do, (work, exercise, tourism, shop, eat,) a location of 2 mile radius is not sufficient to determine relevance. The activity patterns of the people must be known to make the ads congruent and relevant.
Methodology • We mined data from the API of Four Square, a SoLoMo application, and retrieved 87,000 check-ins from 2 miles radius around Times Square, New York, during a summer month. • The data related to individuals checking in to various businesses, including bars, restaurants, shopping malls, movie theaters, workplaces, fitness centers, etc. • Gender and residence location of the user was used to analyze the day of the week, time of the day and location of checkin to reveal individual patterns of activities over time.
Arts & Ent. Top Choices MADISON SQ GARDEN 13790 (24%) MOMA 5295 (9%) Event apocalypse 5278 (9%) Webster Hall2843 (5%) Regal Union Square Stadium 14- 3882 (7%)
Arts & Ent. Check-ins No. of Category Check-ins by Hour
Top Food Brands 2703 (10%) 1245 (4.6%) 1019 (3.7%) 1196 (4.4%) 991 (3.6%)
Food Check-Ins No. of Category Check-ins by Hour
Shopping & Service - Top Picks EATLALY3300 (13%) 3178 (12%)
Shopping Check-ins No. of Category Check-ins by Hour
Night Life Top Check-ins 732 (4%) 230 Fifth Rooftop Lounge- 882 (5%) 909 (5%) STOUT - 680 (3.5%) Lillie’s Victorian Bar -605 (3%)
Night Life Check-ins No. of Category Check-ins by Hour
Analysis • Divided each category into suitable number of subcategories • Combine subcategories that could be perfect substitutes • Ensure sufficient observations to estimate parameters • Used a Multinomial LogitModel for the estimation • Evaluated addition of various 2-way and 3-way interactions in the model • Report results for models that had the best fit based on Log-Likelihood scores and BIC • Given the large number of coefficients estimated for each subcategory, we report only the net average marginal effect
Average Marginal EffectsGender, residence location, time, day of the week
Gender & Residents/tourists • Men are more likely to go to the stadium for entertainment, electronic stores for shopping and sports bars for nightlife • Women are more likely to go to museums, movies, performing arts, Department stores for shopping and Lounges for nightlife. • Locals are more likely to go for general events, Asian food/quick bites, fitness centers and pubs for nightlife.