Download
1 / 21
210 likes | 306 Vues
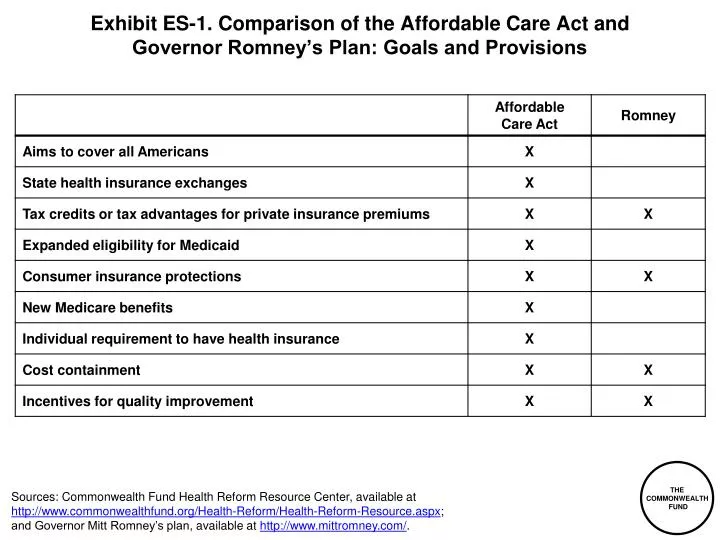
Exhibit ES-1. Comparison of the Affordable Care Act and Governor Romney’s Plan: Goals and Provisions.

E N D
Exhibit ES-1. Comparison of the Affordable Care Act and Governor Romney’s Plan: Goals and Provisions Sources: Commonwealth Fund Health Reform Resource Center, available at http://www.commonwealthfund.org/Health-Reform/Health-Reform-Resource.aspx; and Governor Mitt Romney’s plan, available at http://www.mittromney.com/.
Exhibit ES-2. Numbers of Uninsured Under the Affordable Care Act and Governor Romney’s Plan Millions of uninsured, ages 0–64 Romney Baseline Affordable Care Act Notes: Baseline scenario is if the Affordable Care Act had not been enacted in 2010; Affordable Care Act is full implementation of the law; Romney plan includes full repeal of the Affordable Care Act and replacement with state block grants for the Medicaid program and equalization of the tax treatment of individually purchased health plans and employer plans. Sources: Income, Poverty, and Health Insurance Coverage in the United States: 2011, U.S. Census Bureau, Sept. 2012; estimates by Jonathan Gruber and Sean Sall of MIT using the Gruber Microsimulation Model for The Commonwealth Fund.
ExhibitES-3.PercentofPopulationUninsuredUndertheAffordableCareAct and Governor Romney’s Plan Compared with Baseline by Poverty, 2022 Percent of nonelderly poverty group uninsured in 2022 Note: Baseline scenario is if the Affordable Care Act had not been enacted in 2010; Affordable Care Act is full implementation of the law; Romney plan includes full repeal of the Affordable Care Act and replacement with state block grants for the Medicaid program and equalization of the tax treatment of individually purchased health plans and employer plans. FPL refers to federal poverty level. Source: Estimates by Jonathan Gruber and Sean Sall of MIT using the Gruber Microsimulation Model for The Commonwealth Fund.
Exhibit ES-4. Uninsured Nonelderly Under Baseline and the Affordable Care Act in 2022, by State Baseline Affordable Care Act NH VT NH WA ME VT WA ME MT ND MT ND MN OR MN NY MA NY WI OR SD ID MA WI ID MI SD RI WY MI RI PA WY NJ CT IA PA NJ CT IA NE OH DE NE OH IN NV IL DE WV MD IN NV IL UT VA MD CO DC WV UT VA MO KY KS CO CA DC MO KS KY CA NC NC TN TN SC OK AR AZ OK SC NM AZ AR GA NM AL MS GA AL MS LA TX LA TX FL FL 4%–<10% 20%–<25% AK AK HI HI 10%–<15% 25%–<30% 15%–<20% 30%–<35% 10% of nonelderly uninsured 22% of nonelderly uninsured Note: Baseline scenario is if the Affordable Care Act had not been enacted in 2010; Affordable Care Act is full implementation of the law; Romney plan includes full repeal of the Affordable Care Act and replacement with state block grants for the Medicaid program and equalization of the tax treatment of individually purchased health plans and employer plans. Source: Estimates by Jonathan Gruber and Sean Sall of MIT using the Gruber Microsimulation Model for The Commonwealth Fund.
Exhibit ES-5. Uninsured Nonelderly Under the Affordable Care Act and Governor Romney’s Plan in 2022, by State Romney Affordable Care Act NH NH VT VT WA WA ME ME MT ND MT ND MN MN NY NY OR OR MA WI MA WI ID SD ID SD MI RI MI RI WY WY PA NJ CT PA CT IA NJ IA NE OH NE OH DE DE IN NV IN IL NV IL MD MD WV UT WV UT VA VA CO DC CO DC MO KS KY CA MO KS KY CA NC NC TN TN OK OK SC SC AZ AR AZ AR NM NM GA GA AL AL MS MS LA TX LA TX FL FL 4%–<10% 20%–<25% AK AK HI HI 10%–<15% 25%–<30% 30%–<35% 15%–<20% 10% of nonelderly uninsured 26% of nonelderly uninsured Note: Baseline scenario is if the Affordable Care Act had not been enacted in 2010; Affordable Care Act is full implementation of the law; Romney plan includes full repeal of the Affordable Care Act and replacement with state block grants for the Medicaid program and equalization of the tax treatment of individually purchased health plans and employer plans. Source: Estimates by Jonathan Gruber and Sean Sall of MIT using the Gruber Microsimulation Model for The Commonwealth Fund.
Exhibit ES-6. Average Percent of Income Spent on Health Care in the Nongroup Market Under the Affordable Care Act and Governor Romney’s Plan Compared with Baseline, 2016 Average percent of income nonelderly spent on health care in nongroup market Note: Baseline scenario is if the Affordable Care Act had not been enacted in 2010; Affordable Care Act is full implementation of the law; Romney plan includes full repeal of the Affordable Care Act and replacement with state block grants for the Medicaid program and equalization of the tax treatment of individually purchased health plans and employer plans. Source: Estimates by Jonathan Gruber and Sean Sall of MIT using the Gruber Microsimulation Model for The Commonwealth Fund.
Exhibit ES-7. Estimated Budgetary Effects of Repealing the Affordable Care Act, 2013–2022 Dollars in billions Notes: Totals do not reflect net impact on deficit because of rounding. Source: D. Elmendorf, “Letter to the Honorable John Boehner” (Washington, D.C.: Congressional Budget Office, July 24, 2012).
Exhibit 1. The Number of Uninsured Fell by 1.3 Million People in 2011 Millions of uninsured, full U.S. population Source: Income, Poverty, and Health Insurance Coverage in the United States: 2011, U.S. Census Bureau, Sept. 2012.
Exhibit 2. Premium Tax Credits and Cost-Sharing ProtectionsUnder the Affordable Care Act Catastrophic policy with essential health benefits package available to young adults and people whose premiums are 8%+ of income Notes: Premium and cost-sharing credits are for the silver plan. Federal poverty levels are for 2012. Source: Commonwealth Fund Health Reform Resource Center: What’s in the Affordable Care Act? (PL 111-148 and 111-152), http://www.commonwealthfund.org/Health-Reform/Health-Reform-Resource.aspx.
Exhibit 3. Numbers of Uninsured Under the Affordable Care Act and Governor Romney’s Plan Millions of uninsured, ages 0–64 Romney Baseline Affordable Care Act Notes: Baseline scenario is if the Affordable Care Act had not been enacted in 2010; Affordable Care Act is full implementation of the law; Romney plan includes full repeal of the Affordable Care Act and replacement with state block grants for the Medicaid program and equalization of the tax treatment of individually purchased health plans and employer plans. Sources: Income, Poverty, and Health Insurance Coverage in the United States: 2011, U.S. Census Bureau, Sept. 2012; estimates by Jonathan Gruber and Sean Sall of MIT using the Gruber Microsimulation Model for The Commonwealth Fund.
Exhibit 4. Source of Insurance Coverage Under the Affordable Care Act and Governor Romney’s Plan Compared with Baseline, 2022 Among 276.6 million people ages 0–64 60 million 22% 161 million 58% 41.9 million 15% 13.7million 5% 27.1 million 10% 157.2 million 57% 32.1 million 12% 60.3 million 22% 72.0 million 26% 158.8 million 57% 28.8 million 10% 17.0million 6% Note: Baseline scenario is if the Affordable Care Act had not been enacted in 2010; Affordable Care Act is full implementation of the law; Romney plan includes full repeal of the Affordable Care Act and replacement with state block grants for the Medicaid program and equalization of the tax treatment of individually purchased health plans and employer plans. Source: Estimates by Jonathan Gruber and Sean Sall of MIT using the Gruber Microsimulation Model for The Commonwealth Fund.
Exhibit 5. Percent of Population Uninsured Under the Affordable Care Act andGovernorRomney’sPlanComparedwithBaselinebyAgeGroup,2022 Percent of nonelderly age group uninsured in 2022 Note: Baseline scenario is if the Affordable Care Act had not been enacted in 2010; Affordable Care Act is full implementation of the law; Romney plan includes full repeal of the Affordable Care Act and replacement with state block grants for the Medicaid program and equalization of the tax treatment of individually purchased health plans and employer plans. Source: Estimates by Jonathan Gruber and Sean Sall of MIT using the Gruber Microsimulation Model for The Commonwealth Fund.
Exhibit 6. Percent of Population Uninsured Under the Affordable Care Act and Governor Romney’s Plan Compared with Baseline by Poverty, 2022 Percent of nonelderly poverty group uninsured in 2022 Note: Baseline scenario is if the Affordable Care Act had not been enacted in 2010; Affordable Care Act is full implementation of the law; Romney plan includes full repeal of the Affordable Care Act and replacement with state block grants for the Medicaid program and equalization of the tax treatment of individually purchased health plans and employer plans. FPL refers to federal poverty level. Source: Estimates by Jonathan Gruber and Sean Sall of MIT using the Gruber Microsimulation Model for The Commonwealth Fund.
Exhibit 7. Uninsured Nonelderly Under Baseline and the Affordable Care Act in 2022, by State Baseline Affordable Care Act NH VT NH WA ME VT WA ME MT ND MT ND MN OR MN NY MA NY WI OR SD ID MA WI ID MI SD RI WY MI RI PA WY NJ CT IA PA NJ CT IA NE OH DE NE OH IN NV IL DE WV MD IN NV IL UT VA MD CO DC WV UT VA MO KY KS CO CA DC MO KS KY CA NC NC TN TN SC OK AR AZ OK SC NM AZ AR GA NM AL MS GA AL MS LA TX LA TX FL FL 4%–<10% 20%–<25% AK AK HI HI 10%–<15% 25%–<30% 15%–<20% 30%–<35% 10% of nonelderly uninsured 22% of nonelderly uninsured Note: Baseline scenario is if the Affordable Care Act had not been enacted in 2010; Affordable Care Act is full implementation of the law; Romney plan includes full repeal of the Affordable Care Act and replacement with state block grants for the Medicaid program and equalization of the tax treatment of individually purchased health plans and employer plans. Source: Estimates by Jonathan Gruber and Sean Sall of MIT using the Gruber Microsimulation Model for The Commonwealth Fund.
Exhibit 8. Uninsured Nonelderly Under the Affordable Care Act and Governor Romney’s Plan in 2022, by State Affordable Care Act Romney NH NH VT VT WA WA ME ME MT ND MT ND MN MN NY NY OR OR MA WI MA WI ID SD ID SD MI RI MI RI WY WY PA NJ CT PA CT IA NJ IA NE OH NE OH DE DE IN NV IN IL NV IL MD MD WV UT WV UT VA VA CO DC CO DC MO KS KY CA MO KS KY CA NC NC TN TN OK OK SC SC AZ AR AZ AR NM NM GA GA AL AL MS MS LA TX LA TX FL FL 4%–<10% 20%–<25% AK AK HI HI 10%–<15% 25%–<30% 30%–<35% 15%–<20% 10% of nonelderly uninsured 26% of nonelderly uninsured Note: Baseline scenario is if the Affordable Care Act had not been enacted in 2010; Affordable Care Act is full implementation of the law; Romney plan includes full repeal of the Affordable Care Act and replacement with state block grants for the Medicaid program and equalization of the tax treatment of individually purchased health plans and employer plans. Source: Estimates by Jonathan Gruber and Sean Sall of MIT using the Gruber Microsimulation Model for The Commonwealth Fund.
Exhibit 9. Annual Premium Amount and Tax Credits for a Family of Four Under the Affordable Care Act, 2014 Annual premium amount paid by policy holder and premium tax credit Premium tax credit Required premium payment by policy holder Full premium = $12,130 Contri-butioncapped at 9.5% of income Contri-butioncapped at 8.05% of income Contri-butioncapped at 6.3% of income Contri-butioncapped at 4.0% of income Contri-butioncapped at 3.3% of income $32,326 $35,137 $46,850 $58,562 $70,275 $117,125 Notes: For an family of four, policy holder age 40, in a medium-cost area in 2014. Premium estimates are based on an actuarial value of 0.70. Actuarial value is the average percent of medical costs covered by a health plan. FPL refers to federal poverty level. Source: Premium estimates are from Kaiser Family Foundation Health Reform Subsidy Calculator http://healthreform.kff.org/Subsidycalculator.aspx.
Exhibit 10. Premium Tax Credits and Tax Deductions Under the Affordable Care Act and Governor Romney’s Plan, 2016 Nonelderly population, ages 0–64 Note: Baseline scenario is if the Affordable Care Act had not been enacted in 2010; Affordable Care Act is full implementation of the law; Romney plan includes full repeal of the Affordable Care Act and replacement with state block grants for the Medicaid program and equalization of the tax treatment of individually purchased health plans and employer plans. Source: Estimates by Jonathan Gruber and Sean Sall of MIT using the Gruber Microsimulation Model for The Commonwealth Fund.
Exhibit 11. Average Percent of Income Spent on Health Care in the Nongroup Market Under the Affordable Care Act and Governor Romney’s Plan Compared with Baseline, 2016 Average percent of income nonelderly spent on health care in nongroup market Note: Baseline scenario is if the Affordable Care Act had not been enacted in 2010; Affordable Care Act is full implementation of the law; Romney plan includes full repeal of the Affordable Care Act and replacement with state block grants for the Medicaid program and equalization of the tax treatment of individually purchased health plans and employer plans. Source: Estimates by Jonathan Gruber and Sean Sall of MIT using the Gruber Microsimulation Model for The Commonwealth Fund.
Exhibit 12. System Improvement Provisions of the Affordable Care Act Source: Commonwealth Fund analysis.
Exhibit 13. Overview of Center for Medicare and Medicaid Innovation–Sponsored Initiatives Bundled Payments for Care Improvement. Tests four different payment models to encourage improved care coordination and efficiency related to hospital admissions. Currently selecting participants. Pioneer ACO Model. Tests advanced ACO models. 32 organizations are participating. ACO Advance Payment Model. Tests whether advance payments will assist participation in the Medicare ACO programs for physician-led and rural organizations with limited access to start-up capital. 20 organizations are currently participating. Federally Qualified Health Center (FQHC) Advanced Primary Care Practice Demonstration. Supports 500 FQHCs' transformation to medical homes through $6 per member per month payment for each eligible Medicare beneficiary. Comprehensive Primary Care Initiative. Public and private payer collaborative to strengthen primary care, involving risk-adjusted, monthly care management fees, as well shared savings payments. 7 states and 500 primary care practices are currently participating. Initiative to Reduce Avoidable Hospitalizations Among Nursing Facility Residents. Seeks to improve quality of care for people in nursing facilities by reducing preventable inpatient hospitalizations. Currently selecting participants. Partnership for Patients. Nationwide public–private partnership to support safer care and more effective transitions of patients from hospitals to other settings. $218 million was awarded to 26 organizations to be Hospital Engagement Networks, which help identify and spread solutions already working to reduce health care–acquired conditions. An additional $500 million is available for models improving care transitions and reducing readmissions for high-risk Medicare beneficiaries. Already, 47 participants have been selected for that program. Independence at Home Demonstration. Tests effectiveness of delivering comprehensive primary care at home, focusing on patients with multiple chronic conditions. 15 independent practices and 3 consortia participating. Medicaid Emergency Psychiatric Demonstration. Tests whether Medicaid can support higher-quality care at a lower total cost by reimbursing private psychiatric hospitals for certain psychiatric services for which Medicaid reimbursement has historically been unavailable. 11 states and D.C. are participating. Medicaid Incentives for the Prevention of Chronic Diseases. Provides incentives to Medicaid beneficiaries participating in prevention programs and demonstrate changes in health risk. 10 states are participating. Financial Alignment Initiative. Aligns financial incentives of Medicare and Medicaid to provide Medicare–Medicaid enrollees with a better care experience. This opportunity is open to all states. Currently, one state is participating. State Innovation Models Initiative. A competitive funding opportunity for states to design and test multipayerpayment and delivery models that deliver high-quality health care and improve health system performance. Up to $275 million will be made available for up to 30 grants. Health Care Innovation Awards. Provides grants up to $30 million to participants who are implementing innovative ideas to deliver better health, improved care, and lower costs. 107 grants totaling $894 were awarded. Nearly $2 billion in savings is expected over three years from these initiatives. Strong Start for Mothers and Newborns. Supports reducing the risk of significant complications and long-term health problems for both expectant mothers and newborns. Graduate Nurse Education Demonstration.Provides hospitals with funds for clinical training of advanced practice registered nursing (APRN) students. 5 hospitals are participating. Innovation Advisors Program. Creates a network of delivery system reform experts. 73 advisors have been selected.
Exhibit 14. Estimated Budgetary Effects of Repealing the Affordable Care Act, 2013–2022 Dollars in billions Notes: Totals do not reflect net impact on deficit because of rounding. Source: D. Elmendorf, “Letter to the Honorable John Boehner” (Washington, D.C.: Congressional Budget Office, July 24, 2012).