Download
1 / 37
370 likes | 485 Vues
In this presentation, Professor Steven A. Rutledge from Colorado State University explores the regional and seasonal characteristics of large impulse charge moment change events related to Mesoscale Convective Systems (MCS). By analyzing data from multiple Lightning Mapping Arrays (LMA) and diverse storm environments, we detail how factors like environmental parameters and anomalous charge structures influence storm electrical characteristics. We highlight the notable link between flash rates, NOx production, and the occurrence of Transient Luminous Events (TLEs), providing a comprehensive overview of recent findings and their implications for understanding storm electrification.

E N D
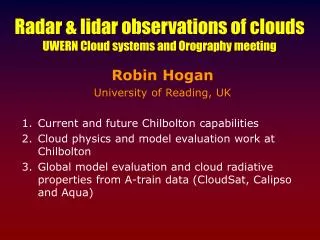
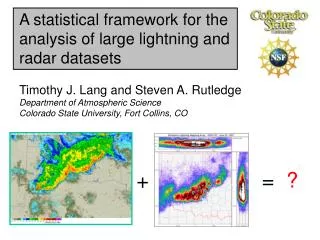
RADAR STUDIES OF LIGHTNING PRODUCING CLOUDS Prof. Steven A. Rutledge Department of Atmospheric Science Colorado State University ILMC 2014 Tucson, AZ
I want to thank…. • CSU students Brett Basarab, Nick Beavis and Brody Fuchs • Timothy Lang (NASA/MSFC) and Walt Lyons (FMA Research) • Steve Cummer and colleagues at Duke • V. N. Bringi and Pat Kennedy at CSU • Eric Bruning (Texas Tech), Paul Krehbiel, Bill Rison and Ron Thomas (New Mexico Tech) and Matt Kumjian (Penn State) • National Science Foundation for financial support
Outline • Regional and seasonal characteristics of large impulse charge moment change events, and in relation to Mesoscale Convective Systems • Distilling some properties of storms with inverted (anomalous) charge structures; regional lightning studies afforded by multiple LMA networks, looking at how environmental parameters relate to storm electrical characteristics • Results from DC3: flash rates and NOx production and a quick look at electrified pyrocumulus
Transient Luminous Events TLE’s clearly linked to large impulse charge moment change events. Also obvious is a link between large positive iCMC’s and Mesoscale Convective Systems Courtesy W. Lyons
Cummer et al. (2013) Using the National Charge Moment Change Network Detects ELF radiation from vertical channel segments of lightning. Examine 5 year climatology of iCMC observations from 2007-2012. Regional and seasonal evaluations.
iCMC (annual) Density; > 100 C km “Large”> 300 C km “Sprite class” _ + _ + 10-2 km-2yr-1 X 0.1 for > 300 C km
Large +iCMC density, Seasonal, > 100 C km 10-2 km-2yr-1
Sprite-Class +iCMCs, Seasonal, > 300 C km Sprite-class iCMC’s maximized in March-August time period and occur in “MCS alley” Ashley et al. 2003 Mon. Wea. Rev. Zajac and Rutledge, 2001 10-2 km-2yr-1
Sprite-Class -iCMCs, Seasonal Sprite class negative iCMC’s do not follow the MCS climatology. Peak density about factor of 10 less than peak density for positive iCMC’s. Negative iCMC’s are generated by non-MCS precipitation, especially in the SE U.S. 10-2 km-2yr-1
Mesoscale Convective Systems ` Charge advected into stratiform region plus generated locally
June 16 2011 Largest iCMC rates occur during growth phase of stratiform region
April 30 2012 Again see iCMC ramping up as as stratiform area blossoms
April 30 2012 Convective region behavior iCMC’s concurrent with active convective precipitation and building stratiform region Intense convection necessary Builds stratiform region and contributes charge via charge advection Strong convection leads to mesoscale ascent in stratiform region which also contributes to charge via local non-inductive charging MCS stratiform region can easily provide requisite charge volumes with modest charge densities 0.1 C/km3 x 1 km depth x 25 kmx 25 km x 5 km = 300 C km Charge Moment Change
Regional Environmental/Lightning Studies To examine relationship between environmental parameters (CAPE, warm cloud depth, LCL, etc) and charge structure / lightning characteristics
Anomalous charge structure Normal charge structure Temperature (°C) -40 -30 -20 -10 0 LMA mode -40 °C -20 °C Use LMA source density profile used to infer charge structure, how do storms develop mid-level or low level dominant positive charge; why are these storms confined to specific geographical locations?
Williams et al. demonstrated Flash Rate linked to cloud base height for tropical locations. They also suggested that optimal intersection of sufficiently large CAPE and significantly elevated cloud base heights may lead to superlative electrification and storms producing dominant positive CG lightning. These storms have inverted or anomalous charge structures (Wiens et al. 2005). Williams et al. (2005)
Now examine environmental variables in these regions • Colorado region; highest flash rates • DC region lowest Flash rates via clustering algorithm developed by E. Bruning and others…
N NCAPE: CAPE divided by the height difference between the LFC and Equilibrium Level. J/kg/m. NCAPE is related to parcel kinetic energy. OK and CO are the winners in terms of NCAPE. Yet CO flash rates are larger.
Colorado median LCL height ~ 3 times higher Cloud base height MSL = 1.4 km + AGL for CO
The final parameter: WCD---vertical distance between cloud base and the freezing level Colorado storms have higher cloud bases and smaller Warm Cloud Depths compared to other regions. Small warm cloud depth leads to higher SLW contents in mixed phase region due to reduced coalescence. Higher LCL/cloud base heights likely reduce fractional entrainment by producing broader updrafts. Both processes lead to a higher adiabatic liquid water content in mixed phase region. High liquid water contents linked to positive charging of rimer via non inductive charging. So where are the most “inverted” storms in our study region?
Plotting peak LMA source density as function of T AL/DC warm positive charge layers associated with decaying, low flash rate storms. EOSO In Colorado, significant amount of active storms have inverted or “anomalous” charge structures. Recall, large NCAPE’s, high CBH’s and shallow WCD’s.
Role of shallow WCD’s and high LCL’s can be considered using recent framework by Bruning et al. (2012). What can radar data can tell us about precipitation physics. Charge reversal temperature Sloping dashed lines represent various liquid water depletion rates. Depletion rates (via riming) decrease from bottom to top. Depletion rates affected by presence of ice particles such as graupel and hail, plus supply of supercooled liquid water driven by storm updraft. Hypothesis: Large WCD (low LCL) introduces large drops immediately above the freezing level which promotes rapid depletion of SLW and negative charge on rimer. Shallow WCD (high LCL) delays presence of rimer, allowing SLW’s to increase at colder temperatures, promoting positive charge on rimer, and inverted (anomalous) charge structure.
Flash Rate A radar based case study using CSU-CHILL 2152z AGL 2152 UTC ZDR column maps lofted supercooled drops LDR cap indicates wet hail Pulsing updraft produces this sequence Positive charge descends as pulse weakens
A similar case where enhanced mid-level positive charge develops after sharp increase in GEV; ZDR column evident in this case too. Zdr column indicates lofting of raindrops into mixed phase region. These drops freeze and grow rapidly into large graupel and hail, feeding on large SLW contents generated by updraft.
Lightning and the production of nitrogen oxides (NOx) Goal: develop improved lightning parameterization schemes using the DC3 dataset
Simple lightning parameterization schemes exist, relating flash rate to bulk storm parameters • Useful for estimating total lightning and NOx production in numerical models • Necessary to rigorously test these schemes against observations (flash rates estimated from LMA data) • Existing schemes tested on four CO cases
Moving beyond the current parmaterizations: Graupel echo volume
Precipitation ice mass (M vs. Z relationship) Are these parameterizations just applicable in a specific region?
Preliminary results suggest that microphysical processes modulating flash rate are not well represented by simple flash rate schemes; the “tuned” parameterizations are still not working well. Still work to do….. Do we use sounding data using NCAPE, WCD and LCL height? Do we resort to storm echo top heights? Much more work needed!
DC3 investigators looking at the behavior of flash rate vs. flash size in order to consider the implications for parameterizations based on alternative lightning metrics • Qualitative assessment shows some anti-correlation between flash rate and average flash size, especially for 6 June late storm - as predicted by Bruning and MacGorman (2013). L. Carey and colleagues working along these same lines. • Important consequences for NOx production via lightning. Preliminary considerations of flash size behavior
~2130-2142 UTC 27 June charge identification; mid-level positive charge below upper-level negative charge. Storms ingesting smoke are inverted; have identical radar structures to normal storms 2100-2200 27 June LMA density; Inverted storm distinctive with more sources and at a lower altitude than surrounding normal convection
Electrified pyrocumulus, polarimetric radar observations Lang et al. 2014, Mon. Wea. Rev.