Understanding Phylogenetic Terminology and Coalescence Processes in Evolution
Explore key concepts of phylogenetic terminology and coalescence processes in evolution, including cladograms, monophyletic groups, shared derived characters, and more. Understand how phylogenetic reconstructions are done through distance analyses and maximum likelihood methods.

Understanding Phylogenetic Terminology and Coalescence Processes in Evolution
E N D
Presentation Transcript
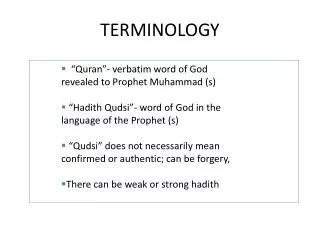
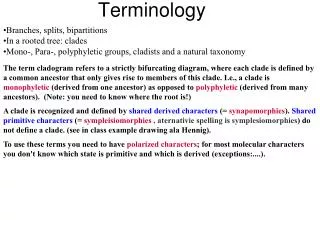
Terminology • Branches, splits, bipartitions • In a rooted tree: clades • Mono-, Para-, polyphyletic groups, cladists and a natural taxonomy The term cladogram refers to a strictly bifurcating diagram, where each clade is defined by a common ancestor that only gives rise to members of this clade. I.e., a clade is monophyletic (derived from one ancestor) as opposed to polyphyletic (derived from many ancestors). (Note: you need to know where the root is!) A clade is recognized and defined by shared derived characters (= synapomorphies). Shared primitive characters (= sympleisiomorphies , aternativie spelling is symplesiomorphies) do not define a clade. (see in class example drawing ala Hennig). To use these terms you need to have polarized characters; for most molecular characters you don't know which state is primitive and which is derived (exceptions:....).
Coalescence – the process of tracing lineages backwards in time to their common ancestors. Every two extant lineages coalesce to their most recent common ancestor. Eventually, all lineages coalesce to the cenancestor. t/2 (Kingman, 1982) Illustration is from J. Felsenstein, “Inferring Phylogenies”, Sinauer, 2003
Coalescence ofORGANISMALandMOLECULAR Lineages Time • 20 lineages • One extinction and one speciation event per generation • One horizontal transfer event once in 5 generations (I.e., speciation events) • RED: organismal lineages (no HGT) • BLUE: molecular lineages (with HGT) • GRAY: extinct lineages • RESULTS: • Most recent common ancestors are different for organismal and molecular phylogenies • Different coalescence times • Long coalescence time for the last two lineages
Y chromosome Adam Mitochondrial Eve Lived approximately 50,000 years ago Lived 166,000-249,000 years ago Thomson, R. et al. (2000) Proc Natl Acad Sci U S A 97, 7360-5 Underhill, P.A. et al. (2000) Nat Genet 26, 358-61 Cann, R.L. et al. (1987) Nature 325, 31-6 Vigilant, L. et al. (1991) Science 253, 1503-7 Albrecht Dürer, The Fall of Man, 1504 Adam and Eve never met The same is true for ancestral rRNAs, EF, ATPases!
EXTANT LINEAGES FOR THE SIMULATIONS OF 50 LINEAGES Modified from Zhaxybayeva and Gogarten (2004), TIGs 20, 182-187
Lineages Through Time Plot 10 simulations of organismal evolution assuming a constant number of species (200) throughout the simulation; 1 speciation and 1 extinction per time step. (green O) 25 gene histories simulated for each organismal history assuming 1 HGT per 10 speciation events (red x) log (number of surviving lineages) green:organismal lineages ; red:molecular lineages (with gene transfer)
The deviation from the “long branches at the base” pattern could be due to • under sampling • an actual radiation • due to an invention that was not transferred • following a mass extinction Bacterial 16SrRNA based phylogeny(from P. D. Schloss and J. Handelsman, Microbiology and Molecular Biology Reviews, December 2004.)
More Terminology Related terms: autapomorphy = a derived character that is only present in one group; an autapomorphic character does not tell us anything about the relationship of the group that has this character ot other groups. homoplasy = a derived character that was derived twice independently (convergent evolution). Note that the characters in question might still be homologous (e.g. a position in a sequence alignment, frontlimbs turned into wings in birds and bats). paraphyletic = a taxonomic group that is defined by a common ancestor, however, the common ancestor of this group also has decendants that do not belong to this taxonomic group. Many systematists despise paraphyletic groups (and consider them to be polyphyletic). Examples for paraphyletic groups are reptiles and protists. Many consider the archaea to be paraphyletic as well. holophyletic = same as above, but the common ancestor gave rise only to members of the group.
Phylogenetic reconstruction Peter Gogarten Office: BSP 404 phone: 860 486-4061, Email:gogarten@uconn.edu
Distance analyses • calculate pairwise distances • (different distance measures, correction for multiple hits, correction for codon bias) • make distance matrix (table of pairwise corrected distances) • calculate tree from distance matrix • i) using optimality criterion • (e.g.: smallest error between distance matrix • and distances in tree, or use • ii) algorithmic approaches (UPGMA or neighbor joining) B) Phylogenetic reconstruction - How
Parsimony analyses • find that tree that explains sequence data with minimum number of substitutions • (tree includes hypothesis of sequence at each of the nodes) • Maximum Likelihood analyses • given a model for sequence evolution, find the tree that has the highest probability under this model. • This approach can also be used to successively refine the model. • Bayesian statistics use ML analyses to calculate posterior probabilities for trees, clades and evolutionary parameters. Especially MCMC approaches have become very popular in the last year, because they allow to estimate evolutionary parameters (e.g., which site in a virus protein is under positive selection), without assuming that one actually knows the "true" phylogeny. Phylogenetic reconstruction - How
Elliot Sober’s Gremlins Observation: Loud noise in the attic ? Hypothesis: gremlins in the attic playing bowling Likelihood = P(noise|gremlins in the attic) P(gremlins in the attic|noise) ? ?
Else: spectral analyses, like evolutionary parsimony, look only at patterns of substitutions, Another way to categorize methods of phylogenetic reconstruction is to ask if they are using an optimality criterion (e.g.: smallest error between distance matrix and distances in tree, least number of steps, highest probability), or algorithmic approaches (UPGMA or neighbor joining) Packages and programs available: PHYLIP, phyml, MrBayes, Tree-Puzzle, PAUP*, clustalw, raxml, PhyloGenie, PyPhy
Bootstrap ? • See here
written and distributed by Joe Felsenstein and collaborators (some of the following is copied from the PHYLIP homepage) Phylip PHYLIP (the PHYLogeny Inference Package) is a package of programs for inferring phylogenies (evolutionary trees). PHYLIP is the most widely-distributed phylogeny package, and competes with PAUP* to be the one responsible for the largest number of published trees. PHYLIP has been in distribution since 1980, and has over 15,000 registered users. Output is written onto special files with names like "outfile" and "outtree". Trees written onto "outtree" are in the Newick format, an informal standard agreed to in 1986 by authors of a number of major phylogeny packages. Input is either provided via a file called “infile” or in response to a prompt.
What’s in PHYLIP Programs in PHYLIP allow to do parsimony, distance matrix, and likelihood methods, including bootstrapping and consensus trees. Data types that can be handled include molecular sequences, gene frequencies, restriction sites and fragments, distance matrices, and discrete characters. Phylip works well with protein and nucleotide sequences Many other programs mimic the style of PHYLIP programs. (e.g. TREEPUZZLE, phyml, protml) Many other packages use PHYIP programs in their inner workings (e.g., PHYLO_WIN) PHYLIP runs under all operating systems Web interfaces are available
Programs in PHYLIP are Modular For example: SEQBOOT take one set of aligned sequences and writes out a file containing bootstrap samples. PROTDIST takes a aligned sequences (one or many sets) and calculates distance matices (one or many) FITCH (or NEIGHBOR) calculate best fitting or neighbor joining trees from one or many distance matrices CONSENSE takes many trees and returns a consensus tree …. modules are available to draw trees as well, but often people use treeview or njplot
is an excellent source of information. The Phylip Manual Brief one line descriptions of the programs are here The easiest way to run PHYLIP programs is via a command line menu (similar to clustalw). The program is invoked through clicking on an icon, or by typing the program name at the command line. > seqboot > protpars > fitch If there is no file called infile the program responds with: [gogarten@carrot gogarten]$ seqboot seqboot: can't find input file "infile" Please enter a new file name>
menu interface example: seqboot and protpars on infile1
Sequence alignment: CLUSTALW MUSCLE Removing ambiguous positions: T-COFFEE FORBACK Generation of pseudosamples: SEQBOOT PROTDIST TREE-PUZZLE Calculating and evaluating phylogenies: PROTPARS PHYML NEIGHBOR FITCH SH-TEST in TREE-PUZZLE CONSENSE Comparing phylogenies: Comparing models: Maximum Likelihood Ratio Test Visualizing trees: ATV, njplot, or treeview Phylip programs can be combined in many different ways with one another and with programs that use the same file formats.
Example 1 Protpars example: seqboot, protpars, consense NOTE the bootstrap majority consensus tree does not necessarily have the same topology as the “best tree” from the original data! threshold parsimony, gap symbols - versus ? (in vi you could use :%s/-/?/g to replace all – ?) outfile outtree compare to distance matrix analysis
branches are scaled with respect to bootstrap support values, the number for the deepest branch is handeled incorrectly by njplot and treeview protpars (versus distance/FM) Extended majority rule consensus treeCONSENSUS TREE:the numbers on the branches indicate the numberof times the partition of the species into the two setswhich are separated by that branch occurredamong the trees, out of 100.00 trees +------Prochloroc +----------------------100.-| | +------Synechococ | | +--------------------Guillardia +-85.7-| | | | +-88.3-| +------Clostridiu | | | | +-100.-| | | | +-100.-| +------Thermoanae | +-50.8-| | | | +-------------Homo sapie +------| | | | | +------Oryza sati | | +---------------100.0-| | | +------Arabidopsi | | | | +--------------------Synechocys | | | | +---------------53.0-| +------Nostoc pun | | +-99.5-| | +-38.5-| +------Nostoc sp | | | +-------------Trichodesm | +------------------------------------------------Thermosyne remember: this is an unrooted tree!
what might be the explanation for the red algae not grouping with the plants? (protpars versus) distance/FM Tree is scaled with respect to the estimated number of substitutions.
protdist PROTdist Settings for this run: P Use JTT, PMB, PAM, Kimura, categories model? Jones-Taylor-Thornton matrix G Gamma distribution of rates among positions? No C One category of substitution rates? Yes W Use weights for positions? No M Analyze multiple data sets? No I Input sequences interleaved? Yes 0 Terminal type (IBM PC, ANSI)? ANSI 1 Print out the data at start of run No 2 Print indications of progress of run Yes
subtree with branch lengths without and with correction for ASRV
phyml PHYML - A simple, fast, and accurate algorithm to estimate large phylogenies by maximum likelihood An online interface is here ; there is a command line version that is described here (not as straight forward as in clustalw); a phylip like interface is automatically invoked, if you type “phyml” – the manual is here. Phyml is installed on bbcxsrv1. Do example on atp_all.phy Note data type, bootstrap option within program, models for ASRV (pinvar and gamma), by default the starting tree is calculated via neighbor joining.
phyml - comments Under some circumstances the consensus tree calculated by phyml is wrong. It is recommended to save all the individual trees and to also evaluate them with consense from the phylip package. Note: phyml allows longer names, but consense allows only 10 characters! phyml is fast enough to analyze dataset with hundreds of sequences (in 1990, a maximum likelihood analyses with 12 sequences (no ASRV) took several days). For moderately sized datasets you can estimate branch support through a bootstrap analysis (it still might run several hours, but compared to protml or PAUP, this is extremely fast). The paper describing phyml is here, a brief interview with the authors is here