Download
1 / 67
680 likes | 1.17k Vues
Childhood Obesity Prevention: Models of Successful Programs. Gina Smith, MSN, FNP-C & Christina Turbeville, CDM FirstHealth Montgomery County School Health Centers Meg McHenry, RD, MPH, LDN & Kara Richards, BA, MA Wake Teen Medical Services. Objectives.

E N D
Childhood Obesity Prevention: Models of Successful Programs Gina Smith, MSN, FNP-C & Christina Turbeville, CDM FirstHealth Montgomery County School Health Centers Meg McHenry, RD, MPH, LDN & Kara Richards, BA, MA Wake Teen Medical Services
Objectives • Describe the magnitude of childhood obesity • Discuss the role of School Health Centers in addressing childhood obesity • Provide examples of successful SBHC programs utilizing best practices • Summarize resources available to providers for assisting in implementation of childhood obesity programs
Obesity Trends* Among U.S. AdultsBRFSS, 1986 (*BMI ≥30, or ~ 30 lbs. overweight for 5’ 4” person) No Data <10% 10%–14% www.cdc.gov
Obesity Trends* Among U.S. AdultsBRFSS, 2007 (*BMI ≥30, or ~ 30 lbs. overweight for 5’ 4” person) No Data <10% 10%–14% 15%–19% 20%–24% 25%–29% ≥30% www.cdc.gov
Prevalence of At-Risk & Overweight Among Children and Adolescents ≥ 85% ≥ 95% Ogden, et al. (2006). JAMA, 295(13), 1549-1555.
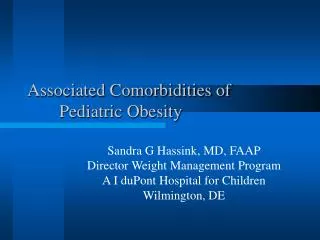
Health Risks of Obesity • Pulmonary • Sleep disorders • Asthma • Obesity-linked hypoventilations • Neurologic • Pseudotumor cerebri
Health Risks of Obesity • Orthopedic • Slipped capital epiphysis • Tibia vara (Blount’s disease) • Tibial torsion • Flat feet • Ankle sprain • Fractures
Health Risks of Obesity • Cardiovascular • Hypertension • Dyslidemia • Fatty deposits • Left ventricular hypertrophy • Other • Systemic inflammation
Health Risks of Obesity • Gastrointestinal • Cholelithiasis • Non-alcoholic fatty liver disease • Gastro-esophageal reflux • Endocrine • Insulin resistance/Type II Diabetes • Acanthosis nigricans • Menstrual abnormalities • Polycystic ovary syndrome • Hypercoricism
Health Risks of Obesity: Psychological Obese children and their parents rate the quality of life as similar to pediatric cancer patients. Schimmer, Burwinkle, & Varni, 2003
Health Risks of Obesity: Psychological • Actual and perceived overweight is an important risk factor for suicidal behaviors in youth • Risk factor for suicidality even after controlling for alcohol and illicit drug use (Swahn, M., Reynolds, M., Tice, M., et. al, Journal of Adolescent Health, 2009.)
Significance of Problem 80% of obese adolescents will become obese adults - NASBHC, 2009
The Role of SBHCs in Addressing Childhood Obesity • Leader in child health to emphasize prevention and early intervention • Sensitive to unique needs of children and adolescents with the ability to provide culturally sensitive, age-appropriate services • Opportunity for access to students with services provided regardless of the ability to pay • Qualified, highly trained, interdisciplinary teams comprised of RD, nutritionist, FNP, RN
FirstHealth of the CarolinasMontgomery County School Health Centers, East & West • East & West Middle Schools • Comprehensive, credentialed centers • 670 total registrants
BMI Data Collection 2007-08 • Great partnership with Montgomery County Schools • Collaboration with school nurses, teachers and students • SBHC nurses • SBHC Nutritionist • SBHC FNP
Page Street Intervention – HEAP“Healthy Eating Active Play” • 3rd Graders – 39% obese; 16% overweight • Intervention developed –RD, Nutrition Educator, FNP • Nutrition Educator as instructor • 4-week program • Pretest of knowledge and behaviors • One 45 minute class/week . Fun activities & healthy snacks focusing on healthy eating and increasing physical activity • Post-test • BMIs recalculated
Week 1 – What to Dump SODA CHIPS SWEET TEA COOKIES KOOL-AID CANDY LEMONADE DORITOS SUNNY DELIGHT HOT FRIES POWERADE CHEETOS GATORADE LITTLE DEBBIES FRUITOPIA CAKES &PIES YOOHOO BROWNIES CAPRI-SUN CHOCOLATE NABS HONEY BUNS RICE KRISPY TREATS KLONDIKE BARS
Week 1 – What to Pick Up 1% OR SKIM MILK WATER CAFFEINE FREE/ UNSWEETENED TEA CAFFEINE FREE / DIET SODA HOMEMADE LEMONADE WITH SPLENDA 100% JUICE ONCE A DAY ONLY LITE MICROWAVE POPCORN CELERY / PEANUT BUTTER CARROTS WITH LOW FAT DRESSING PEANUT BUTTER CRACKERS (whole wheat) APPLES-ORANGES-BANANAS-FROZEN GRAPES STRING CHEESE NUTS RAISINS, DRY CHEERIOS, PRETZELS FROZEN YOGURT
Week 2 WHAT FRUITS TO ADD TO BREAKFAST Bananas Raisins Apples Peaches Cut up fruit to top your waffles versus syrup Yogurt in place of syrup Eat your fruit & vegetables that come with lunch! FRUITS & VEGETABLES TO ADD TO LUNCH & SUPPER Carrots & celery sticks Cucumber slices Applesauce cups Apples, oranges, or bananas Bring salad to school Supper – ½ of your plate should be vegetables Try the vegetables your mom makes at least three times before you say you don’t like it.
Week 2 – Healthy Eating and Physical Activity Go Hand in Hand Exercise can be fun – in fact it’s child’s play! Make it a family affair Limit TV viewing time to 2 hours or less/day Be physically active for 60 minutes every day
Week 3 HOW SHOULD YOUR PLATE LOOK? One-half (1/2) of your plate should have vegetables One-fourth (1/4) of the plate should have your meat or protein One-fourth (1/4) of the plate should have your starches (bread, pasta, rice, potatoes)
Week 4 – Healthy Meals on the Run RESTAURANTS CHOICES McDonalds 1% milk, mandarin oranges, unsweetened tea, apple dippers, or yogurt with fruit Zenos Grilled chicken, vegetable pizza, salad Sir Pizza Salad bar, fruit choices, vegetable pizza Mazatlan Ask the waiter to take the chips off the table when you sit down. Take ½ of your order home for a later meal. Penny’s Order the small order and stay away from sauces. BoJangles Grilled chicken, no biscuit. Ask for a bun instead. Subway Ask for the kid’s meal, salad and no chips.
Results??? BMI – 1% decrease in obese students from 39% to 38% Correct answers: Pretest – 51% Post-test – 98%
2008 NC Stars Fruit and Veggies Silver Award – Healthcare Division
Page Street 5th Graders 09-10 Page Street 5th Graders 2009-10 0% 39% 41% BMI = 95% BMI 85%-94% BMI Normal BMI < 5% 20%
Childhood Obesity Action Network. State Obesity Profiles, 2008. National Initiative for Children's Healthcare Quality, Child Policy Research Center, and Child and Adolescent Health Measurement Initiative.
2008-09 Childhood Obesity Efforts • Nutritional assessment utilizing HEAP quiz on all students enrolled at the SBHCs (EMS/WMS) • Ht/wt/BMI calculated and plotted • Early referrals made to SBHC nutritionist for BMI 85% • Referral to SBHC RD for BMI ≥ 95% • 2-3 nutritional counseling sessions –1345 nutrition visits
SHC/school-wide 2008-09 Efforts • Alignment with MCS system goals – “Promote a child-centered culture of health, rigor, and high expectations” • Nutrition educator collaborated with school staff in forming after school walking clubs at both middle schools – 130 miles walked • Health Eating Every Day (HEED) classes for school staff • BMI data collection for all MCS students grades pre-K-12
SHC/school-wide 2008-09 Efforts • HEAP presentations: • Presented to Candor 3rd graders – last year were most obese in MCS at 41% obese • Green Ridge 3rd graders • Mt. Gilead 4th graders • 176 HEAP students this year
2008-09 BMI Trends Montgomery County Schools BMI Data 2008-09 2% 27% BMI = 95% BMI 85-94% BMI Normal 52% BMI < 5% 19%
2008-09 BMI Trends Childhood Obesity Action Network. State Obesity Profiles, 2008. National Initiative for Children's Healthcare Quality, Child Policy Research Center, and Child and Adolescent Health Measurement Initiative.
SHC BMI Trends Overall decrease in BMI of OB/OW students: 71% n = 279
2008-09 HEAP Outcomes Candor/Green Ridge/Mt. Gilead Pretest – 58% Correct Post-test – 93% Correct
Additional School-wide efforts • SPARK curriculum in K-8 www.spark.org • Fitnessgram software to track BMI • Healthy Kids/Healthy Communities grant • School Nutrition Director developing healthier menus • 3 schools received fruit grants
2009-10 SHC Efforts • Nutritional assessment on all SBHC enrollees • Prevention/early intervention • 5-3-2-1-Almost None • Increased nutritional services for SHCS in 2009-10 by increased nutritional services to 4 days total/week • Registered Dietician for students ≥ 99% • Actively seek resources/funding for innovative methods for addressing childhood obesity
2009-10 SHC BMI Trends Nutrition Referrals for OB/OW n=261 • BMI ≥ 99% = 19% • BMI ≥ 95-98 = 42% • BMI 85-94% - 36% • BMI <5% or other = 3% 61% obese!!
Additional Efforts • Present HEAP program to Green Ridge 1st graders – BMI: 33%OB/30%OW • Fasting glucose, lipids, ALT, AST, etc. • Actively seek resources/funding for innovative methods for addressing childhood obesity • Look for ways to incorporate more physical activity into the SHC programs • Collaborate on a local, state and national level in addressing childhood obesity
Childhood Obesity Prevention: Models of Successful ProgramsBe Fit, Get Moving Kara Richards, MA Meg McHenry, RD, MPH, LDN
Wake Teen Medical Services • Wake Teen Medical Services is a non-profit medical service provider for adolescents through young adults ages 10 to 23 • Services include: • Primary health care • Mental health care • Health education • Nutrition counseling
Wake Teen Medical Services • Saw 1473 patients in the last year • Patient demographics • 975 female, 498 male • 989 African American, 446 White, 38 Other/Unidentified • Over 30% of patients fall at or above the 85th BMI percentile • Wake County obesity prevalence • For ages 12-17, 21% classify as overweight and 30% as obese