low
10 5. 10 5. 10 4. 10 4. 10 3. 10 3. 10 2. 10 2. 10 2. 10 2. 10 3. 10 3. 10 4. 10 4. 10 5. 10 5. A. (X1000). (X1000). 250. 250. 200. 200. SSC. SSC. CD34-PE-Cy7. CD34-PE-Cy7. 150. 150. 0.3%. 100. 100. 50. 50. 50. 100. 150. 200. 250. 10 2. 10 3. 10 4. 10 5.


low
E N D
Presentation Transcript
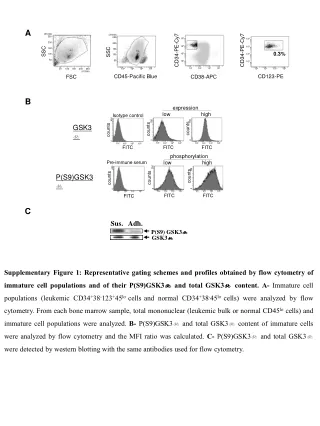
105 105 104 104 103 103 102 102 102 102 103 103 104 104 105 105 A (X1000) (X1000) 250 250 200 200 SSC SSC CD34-PE-Cy7 CD34-PE-Cy7 150 150 0.3% 100 100 50 50 50 100 150 200 250 102 103 104 105 (X1000) CD45-Pacific Blue CD123-PE FSC CD38-APC B expression low high Isotype control 400 250 700 GSK3b counts counts counts 0 0 0 102 103 104 105 102 103 104 105 102 103 104 105 FITC FITC FITC phosphorylation low high Pre-immune serum 250 400 125 counts P(S9)GSK3b counts counts 0 0 0 102 102 103 104 105 102 103 104 105 103 104 105 FITC FITC FITC C Sus. Adh. P(S9) GSK3 GSK3 Supplementary Figure 1: Representativegatingschemes and profiles obtained by flow cytometry of immature cell populations and of their P(S9)GSK3b and total GSK3b content. A- Immature cell populations (leukemic CD34+38-123+45lo cellsand normal CD34+38-45lo cells) wereanalyzed by flow cytometry. Fromeachbonemarrowsample, total mononuclear (leukemicbulk or normal CD45locells) and immature cell populations wereanalyzed. B- P(S9)GSK3b and total GSK3b content of immature cellswereanalyzed by flow cytometry and the MFI ratio wascalculated. C- P(S9)GSK3b and total GSK3bweredetected by western blottingwith the sameantibodiesused for flow cytometry.
Sus. Adh. A B 105 105 1,4% 1,5% CD34-PE-Cy7 CD34-PE-Cy7 Normal karyotype 104 104 AML normal karyotype 103 103 AML complex karyotype 102 102 Healthy donors AML 102 102 103 104 105 103 104 105 CD38-APC CD38-APC CD34-PE-Cy7 CD34-PE-Cy7 Bulk Adherent cells 105 105 15% 14% Complex karyotype 104 104 % 100 103 103 102 102 102 103 104 105 102 103 104 105 CD38-APC CD38-APC CD34-PE-Cy7 CD34-PE-Cy7 50 105 105 0,6% 0,4% Normal (healthy donors) 104 104 103 103 0 102 102 102 102 103 104 105 103 104 105 CD38-APC CD38-APC Supplementary Figure 2: Maintenance of immature cell fraction (CD34+38-) upon cell adhesion. Cells from healthy donors and AML patients (with normal or complex karyotype) were incubated for 1h in the absence of serum and then allowed to adhere on fibronectin matrix as described in Material and Methods. After 1h adhesion, the percentage of adhered cells in total mononuclear fraction was quantified by crystal violet (B, n=3, mean ± S.E.M.). Also, percentages of CD34+38- cells were analyzed before and after cell adhesion by flow cytometry (A). Data are representative from 16 AML patients with normal karyotype, 8 AML patients with complex karyotype and 12 healthy donors.
AML CD34+38-123+ cells Male patient AML CD34+38-123+ cells Female patient suspension suspension adhesion adhesion 300 300 250 600 32% counts counts 25% Non-treated control counts counts 12% 15% 0 0 0 0 102 103 104 105 102 103 104 105 102 103 104 105 102 103 104 105 APO2.7-PE-Cy5 APO2.7-PE-Cy5 APO2.7-PE-Cy5 APO2.7-PE-Cy5 500 300 300 250 30% 70% counts counts counts counts SB216763 12% 17% 0 0 0 0 102 103 104 105 102 103 104 105 102 103 104 105 102 103 104 105 APO2.7-PE-Cy5 APO2.7-PE-Cy5 APO2.7-PE-Cy5 APO2.7-PE-Cy5 a- Sus. Adh. P(S9)GSK3b P(S641)GS b- Supplementary Figure 3: Representative P(S9)GSK3b, P(S641)GS and APO2.7 flow cytometry profiles of AML CD34+38-123+ cells in suspension or adhesion. Labelling by antibodiesdirected to P(S9)GSK3b and P(S641)GS (glycogensynthase)(a)and by APO2.7-PE-Cy5 (b) are described in Material and Methods. In a, 2500 cellswerecounted in average and in b, apoptoticresponses to the GSK3 inhibitor SB216763 are shown.
90 90 counts counts 0 0 102 103 104 105 102 103 104 105 FITC FITC a- AML CD34+38-123+ cells Male patients P(S9)GSK3b Sus. Adh. Adh. + LY294002 Adh. + Wortmannin 90 90 counts counts 0 0 102 103 104 105 102 103 104 105 FITC FITC Inhibited GSK3b P(S9)GSK3b/GSK3b control LY294002 Adhesion (n=3) MFI ratio 3 wortmannin b- AML CD34+38-123+ cells Male patients AML CD34+38-123+ cells Male patients Suspension 2 Adhesion ** ** 1 * Apoptosis Apoptosis ** *** ** % % 70 70 0 ** * 1h 24h 60 60 * * 50 50 * * 40 40 30 30 20 20 *** 0 0 Etop. Ara-C Ara-C Etop. Ct. NAC DPI NAC DPI Ct. Supplementary Figure 4: GSK3b modulation and disparity in apoptotic response of immature leukemic cells from male AML patients. After 1h serum starvation and then 1h adhesion on fibronectin, AML samples were treated or not (Ct.) with LY294002 (10 mM), Wortmannin (0.1 mM), Ara-C (1 mM), Etoposide (1 mM), NAC (N-acetyl-l-cysteine from Sigma Aldrich, 50 mM) or DPI (Diphenyliddonium chloride from Flüka, 25 mM). At the end of 1h incubation period, cells were washed, treated for P(S9) GSK3b analysis (a) or incubated in serum-containing medium for 24h for further analysis of P(S9) GSK3b (a) andapoptosis (b). P(S9) GSK3b and apoptosis were measured by flow cytometry in immature leukemic fraction (CD34+38-123+ cells) as described in Material and Methods. Results were evaluated as the percentage of apoptotic cells in suspension or in adhesion for each treament. Data are from 16 male AML patients: 12 developed CAM-DR to etoposide (left panel) and 4 to Ara-C displaying also pro-apoptotic response to anti-oxidants NAC and DPI (right panel). Comparison to respective control in suspension or in adhesion, or as indicated: mean ± S.E.M. *P<0.05 **P<0.01 ***P<0.001.
Suspension Adhesion AML CD34+38-123+ cells Female patients AML CD34+38-123+ cells Male patients Apoptosis Apoptosis % % 70 70 60 60 50 50 40 40 30 30 20 20 0 0 Testosterone Estradiol Testosterone Estradiol Ct. IGF-1 Ct. IGF-1 Supplementary Figure 5: Hormonal treatment does not modify survival of immature leukemic cells from female and male AML patients. Serum-starved adherent cells from 4 female and 4 male AML patients were treated or not (Ct.) with IGF-1 (RD, 3x10⁻⁹M), 19-nortestosterone 17-decanoate (Sigma Aldrich, 10-8M) or 17b estradiol (Sigma Aldrich, 10-8M) for 1h. At the end of the incubation period, cells were washed and incubated in serum-containing medium for 24h. Measurement of apoptosis was performed by flow cytometry in immature leukemic fraction (CD34+38-123+ progenitors) using labeling by APO2.7 as described in Materials and Methods. Results were evaluated as the percentage (mean ± S.E.M.) of apoptotic cells in suspension or in adhesion for each treatment.
GSK3b GSK3b Low level High level P-value Patients % (n) 20 (15) 80 (58) Median age (years) 47 54 ns ns Gender (%) 53 62 Male 47 38 Female WBC (x109/L) 62 72 ns Cytogenetic % 14 51 n 79 20 Favorable 47 0 Intermediate 21 33 Unfavorable FAB subtypes (%) 0 6 M0 7 13 M1 0 34 M2 64 2 M3 14 25 M4 7 13 M5 CD34+ % (n) 39 (14) 61 (48) <0.05 ns 29 (14) 23 (48) FLT3-ITD % (n) Supplementary Table 1: Initial clinico-biological characteristics of 73 AML patients according to GSK3b expression. The level of GSK3b was analyzed by western blot and groups « high » and « low » levels were determined by comparison with CD34+ normal cells. FAB, French American British classification; WBC, White Blood Cell count; CD34+, percentage of CD34+ in the total mononuclear cell fraction; FLT3-ITD, FLT3 Internal Tandem Duplication; ns, not significant. Patient characteristics and clinical parameters were compared between different groups of AML patients (high vs low GSK3 expression and female vs male) using the 2 test.
AML CD34+38-123+ cells Female Male suspension adhesion suspension adhesion ERa 3037 ± 247 3381 ± 222 3582 ± 317 4037 ± 420 IGF1R 6683 ± 817 4554 ± 944 6338 ± 1154 5194 ± 918 Integrin a4 20153 ± 4758° 16259 ± 3074 10425 ± 2454 10430 ± 2550 Survivin 2942 ± 344 4088 ± 399 4111 ± 954 3537 ± 616 P21 4782 ± 205 7790 ± 1045* 4554 ± 847 4309 ± 886 P27 5936 ± 802 5347 ± 880 5581 ± 567 4646 ± 588 P(S473)Akt 2837 ± 300 2790 ± 276 4625 ± 1056 3882 ± 203 Akt 9494 ± 1581 12915 ± 3281 3892 ± 226 4133 ± 632 P(S473)Akt/ Akt 0.29 ± 0.10 0.21 ± 0.08° 1.18 ± 0.20 0.90 ± 0.25 Supplementary Table 2: Expression of several hormone and adhesion receptors and signaling molecules in immature leukemic cells from female and male AML patients. Cells from AML patients were incubated for 1h in the absence of serum and then allowed to adhere on a fibronectin matrix. After 1h adhesion, protein expression was quantified by flow cytometry in immature fractions (CD34+38-123+ cells) as described in Material and Methods. Results are expressed as the mean fluorescence intensity (MFI) of stained samples. Data are from 3 to 9 female and 4 to 16 male AML patients (mean ± S.E.M, ° comparison between female and male patients P<0.05, *comparison adhesion vs suspension P<0.05). Source of material: Era and IGF1R polyclonal antibodies (Abcam), a4 monoclonal antibody (Chemicon), Akt and p21 polyclonal antibodies (Santa Cruz Biotechnology), P(S473)Akt polyclonal antibody (Cell Signaling technology).
AML CD34+38-123+ cells % apoptosis in adhesion P(S9)GSK3b/GSK3b RACK1 level suspension adhesion Cont. Etop. SB216763 suspension adhesion 5.00 2.34 11622 15800 15 13 35 Male AML patient #28 1.21 1.76 2300 1600 28 60 27 Female AML patient #18 2.50 1.90 4000 8000 36 25 60 U937 Supplementary Table 3: Discordant sex-related GSK3 phenotypes of one female and one male AML patients, and U937. Measurement of GSK3 phosphorylation, apoptosis and RACK1 level were performed as described in Material and methods. Note that AML patients #18 and #28 have no specific clinico-biological characteristics (not shown).