Economic Growth
200 likes | 387 Vues
Economic Growth. Let’s note the economic growth is thought of as either an increase in Real GDP or an increase in Real GDP per capita. Digress : the handy rule of 70 (Some people say 72)

Economic Growth
E N D
Presentation Transcript
Economic Growth Let’s note the economic growth is thought of as either an increase in Real GDP or an increase in Real GDP per capita
Digress : the handy rule of 70 (Some people say 72) This idea is about the number of years it takes something to double in size if growing at rate r (this is an approximation, but a handy rule none the less) 70 divided by r, where r is expressed as a %, not a decimal. Example: 3% growth a year 70/3 = 23.33 2% growth a year 70/2 = 35
So with a RGDP growth rate at 3% the size of the “economic pie” doubles about every 23 years. If growth is only 2% it takes about 35 years for the size of the economy to double. Why should we care about the growth? Well, the population tends to grow, does it not? And the growing population wants a good standard of living, right? So, keep the growth rate up to keep the standard of living (in the sense of per capita income – the RGDP divided by the population) at least constant, or better yet, growing.
Let’s note two things about the RGDP. 1) Over the long haul, or long term, RGDP has moved upward and this is called economic growth. 2) In the short term there are economic fluctuations - ups and downs in the level of RGDP. This shorter term pattern is often called the business cycle.
RGDP per capita is the RGDP divided by the population. In this sense it is a measure of what people get on average. It is generally thought that as the RGDP per capita gets larger the standard of living, or economic well-being, of the country is growing. In the year 2000 the RGDP per capita in the US was around $37,000. The growth rate was, on average, 1.81% for the US for the period of time 1870, yes 1870, to the year 2000. 1.81% growth means the economy doubled in size every 70/1.81 = 39 years or so. So over the last 140 years the US economy doubled in size roughly 4 times (in per capita terms.)
The catch-up effect analogy first - people who have never played golf before will probably start out shooting about a 60 for nine holes, whereas folks who have played for some time will shoot around 45 or better. Now if both types of players play about the same amount of golf the 60’s shooter will lower scores quicker than the 45 shooter. The logic is the 60’s shooter has beginners stuff to learn and the finer points of the game, while the 45 shooter only has to work on the finer points. The beginner stuff is relatively easy and so the 60 shooter can lower the score by 10 shots quickly, whereas the finer points are hard to get and thus to lower a 45 to 35 is a lot harder. So, when we are relatively new, the scores lower more quickly that when we are a veteran. The relatively new players experience the catch-up effect (terminology here - not to be confused with the spot on your shirt after eating a burger – that is the ketchup effect).
Counties with low rates of capital usage will experience the catch-up effect early on as they employ more capital, but eventually diminishing returns will set in. Similarly the rate of growth of RGDP will be high at first but then the rate of growth will slow. The US is often criticized for having low rates of growth compared to other countries. But, remember we are the biggest economy in the world. Exaggerated example: US economy grows from 13 trillion to 14 trillion – a 7.7% gain in GDP. Mexico grows from 2 trillion to 3 trillion – a 50% gain. When you just look at percent US looks weak.
Population Growth and some guy named Malthus Malthus, a man dead for many years now, thought the human race was doomed to a subsistence level of output. To Malthus the population would grow faster than output and we would end up with less and less stuff per person. Eventually this would mean we would all be miserable – (imagine Tiny Tim’s family before Scrooge has a change of heart). I like to think that Malthus thought the human race was like a population of deer. Eventually the size of the population gets so large that there is not enough food to go around and thus the population dies off. The thing Malthus did not foresee was the advancement of technology and the use of capital goods. Technology and capital goods overcome population crowding and provide us with increased living standards. Was Malthus just ahead of his time (but basically right?) or will technology and capital continue to keep us ahead of the doom and gloom? Only time will tell, but I think Malthus will always be wrong. But, I thank him for thinking. We must always be vigilant on these matters!
Let’s perform a trick that will show us an interesting result. You and I now know that RGDP per capita = RGDP/Pop. Here is the trick. Let’s multiply this definition by 1, where 1 = the number of workers divided by the number of workers. We get RGDP per capita = (RGDP/Pop)(number of workers/number of workers) and then rearranging we get RGDP per capita = (RGDP/number of workers)(number of workers/Population). If here Y = RGDP Y/POP = (Y/N)(N/POP). Y/N is called average labor productivity, where N = the number of workers. So, the RGDP per capita depends in part on the average labor productivity.
Here we study what can make average labor productivity grow. 1) Work harder. If labor works harder than perhaps productivity can grow and we can get more output per worker. But, this method of getting output is just one, and probably not the most important, factor in increasing labor productivity. 2) Human capital. Human capital refers to talents, education, training and skills of workers. You what to know something? It is easy to kick someone in the face when you are standing on their shoulders. I mention this because down through the ages we have accumulated knowledge about how to do things. In the present day we build on what we have learned from the past and this has certainly increased our average labor productivity.
3) K – Capital (K is capital because C is for consumption and not because Marx wrote Das Kapital.) Capital, or physical capital, are the tools we make to help us make other stuff (and when businesses get them we said it is done through investment). These tools make us much more productive in terms of ability to generate output. I was watching the history channel one day and there was a program about lumber. It was mentioned that the tools used to cut wood have been refined in such a way that per tree we can get more pieces of lumber. Basically the teeth of the saws have been made smaller and better. This enhances the output per worker. 4) Natural resources and Land. The quality of land in a country contributes to average labor productivity, but what gives a boost is discovering more of the other natural resources we have. This would include petroleum and metals and stuff like that.
5) Technology Think about personal computers today. They really are pieces of capital. But they are more sophisticated today and the same size box today does now more than ever. So we have had technological advancement. In the US economy we have had tremendous advancement in areas such as transportation, communications, manufacturing and medicine.
6) Entrepreneurship and management. You have probably heard of the names Ford, Carnegie, Rockefeller, Walton and Gates. These folks, and many more like them, are called entrepreneurs and they have started new enterprises. Their work has often lead to improvements in the way we do things and thus labor productivity has been enhanced. 7) Political and legal environment. How would you like it if you had to give me 5 bucks every day? You probably wouldn’t like it. You might even think your private property is being taken unjustly and maybe you wouldn’t produce stuff so you wouldn’t have the 5 bucks. Governments have a role in making average labor productivity higher by establishing rules (laws) that are conducive to productivity. Well defined property rights help promote productivity because we know what we can do with the resources we control.
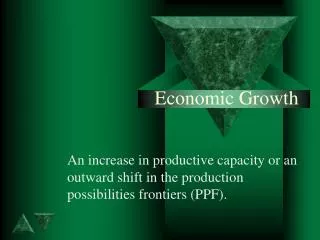
Economic growth Economic growth is a situation where more can be produced in an economy. In our model of production possibilities we assumed that resources and the state of technology were fixed. But if these things actually change in that we get more of them, then the curve shifts out. This would be an indication of economic growth. On the next slide lets focus on two special kinds of output - consumption goods and capital goods.
Special PPC Capital N M L Consumption Recall from our earlier work that moving more toward point N from L or M means that in future years we can have even more economic growth.
Special PPC When we recognize that capital is a resource that is man made we recognize we have a trade-off between present and future consumption. As we compare points N, M and L on the previous screen we see point N has the most capital, but the least consumption. The more we move to point N, the less current consumption we have, the more future consumption we can have because with more of the resource capital, the more the curve would shift out.