Download
1 / 1
10 likes | 163 Vues
Integrated Analysis of Transportation Network with Pipeline System Vulnerabilities Berrin Tansel 1 , Xia Jin 1 , Kollol Shams 1 , Bahareh Inanloo 1 , Albert Gan 1 1 Department of Civil and Environmental Engineering, Florida International University, Miami, FL, 33199.

E N D
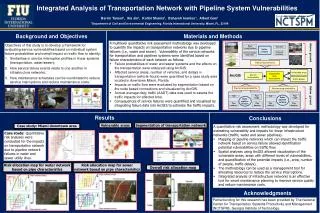
Integrated Analysis of Transportation Network with Pipeline System Vulnerabilities Berrin Tansel1, Xia Jin1,Kollol Shams1, Bahareh Inanloo1, Albert Gan1 1Department of Civil and Environmental Engineering, Florida International University, Miami, FL, 33199 Background and Objectives Materials and Methods • A multilevel quantitative risk assessment methodology was developed to quantify the impacts on transportation networks due to pipeline failures (i.e., water and sewer). Vulnerability of the service networks for transportation and pipelines systems were identified based on failure characteristics of each network as follows: • Failure probabilities of water and sewer systems and the effects on the transportation were analyzed using ArcGIS. • Affected service areas, number of vehicles, and delays in transportation (vehicle-hours) were quantified for a case study area located in downtown Miami, Florida. • Impacts on traffic flow were evaluated by segmentation based on the node based connections and visualized by ArcGIS. • Annual average daily traffic (AADT) data was used to assess the traffic impacts for affected links. • Consequences of service failures were quantified and visualized by integrating failure data into ArcGIS to estimate the traffic impacts. • Objectives of this study is to develop a framework for evaluating service vulnerabilities based on individual system failure probabilities and overall impact on traffic flow to identify: • Similarities in service interruption profiles in linear systems (transportation, water/sewer); • How service failure events relate to one another in infrastructure networks; • How maintenance schedules can be coordinated to reduce service interruptions and reduce maintenance costs. Results Conclusions Vulnerable areas Segmentation of transportation network Case study: Miami downtown area • A quantitative risk assessment methodology was developed for estimating vulnerability and impacts for linear infrastructure networks (traffic, water and sewer pipelines). • Mapping of pipeline networks which can impact the traffic network based on service failure allowed identification potential vulnerabilities on traffic flow. • Spatial analyses using ArcGIS allowed visualization of the vulnerable areas, areas with different levels of vulnerabilities, and quantification of the potential impacts (i.e., area, number of people, traffic delays). • The methodology can be used as a management tool for allocating resources to reduce the service interruptions. • Integrated analysis of infrastructure networks is an effective tool for smart maintenance planning to improve service quality and reduce maintenance costs. Case study: Quantitative risk analyses were conducted for the impacts on transportation network due to pipeline network failures in water and sewer utility lines. Risk allocation map for water network based on pipe characteristics Risk allocation map for sewer network based on pipe characteristics Overall risk allocation map Acknowledgments Figure 2 Partial funding for this research has been provided by The National Center for Transportation Systems Productivity and Management (NCTSPM), Georgia Institute of Technology.