Download

1 / 35
350 likes | 437 Vues
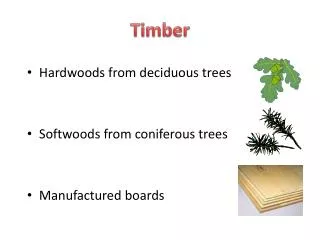
16394 & 16469 Group A. Timber Research Centre. Michael Anderson– Mohamed Farid Pablo Prallong – Lewis Macleod Ross Turbet. 4 th Presentation. 26/04/2005. Presentation Agenda. Introduction to Project Building Description Demands Demand Side Management Techniques

E N D
16394 & 16469 Group A Timber Research Centre Michael Anderson– Mohamed Farid Pablo Prallong – Lewis Macleod Ross Turbet 4th Presentation 26/04/2005
Presentation Agenda • Introduction to Project • Building Description • Demands • Demand Side Management Techniques • ESP-R – Design Changes • Homer • Control • Supply • Conclusion
Our Aim • Use Demand Side Management to facilitate the embedding renewable energy to a Timber research centre • Apply design changes to match building energy demands with renewable supply. • Show results through simulation and website.
Review of the building • Timber Research Centre • Up to 80 occupants • Situated in outskirts of Glasgow • Typical of offices (loads) across Central Scotland (weather)
Building Demands • Heating • Space heating • Hot water • Electrical • Lighting • Ventilation • Machinery • Other appliances
Heating Demands Electrical Demands Calculating Demands Esp-r Model
Seasonal Demands • Heating demands
Seasonal Demands • Electrical Demands
Demand Side Management. • Strategies utilised throughout the project. • Peak clipping • Valley filling • Load shifting • Design changes made in order to implement these strategies. • How these changes have affected the demands of our design.
Design changes 1.Peak clipping To help lower the demand, we looked to significantly reduce the loads in the building • Natural lighting. • Natural heating. • Energy reduction in cafeteria.
Design changes 2.Valley filling The goal is to build up off-peak loads in order to smooth out the load and improve the economic efficiency of the building. • Heating slowly turned on in the morning before occupancy • Heating during the weekends.
Design changes 3.Load shifting The idea behind load shifting is to move the times of peak energy usage to times where there is a excess of electricity. • Stagger times at which occupants enter the building. • Change designated break times throughout the day.
Effects of changes. • Lower demand peaks in spaces, both in terms of heating and lighting. • Smoothened demand curve • Better options and feasibility for supply matching.
U-Value • External wall properties • Weatherboard: 100mm • Glasswool: 75 • Air Gap: 50 • Breezeblock: 100 • Overall U-Value = 0.39W/m2K
External Wall Construction • New Wall Properties • Weatherboard: 100mm • Glasswool: 200 • Air Gap: 50 • Breezeblock: 100 • Overall U-Value = 0.16W/m2K
Daylight • Utilising as much daylight as possible
Daylight • Careful to avoid glare & unwanted heat gains
Heating control • Continuous heating… • Pre-Heat 0000 – 0700 (12DegC) • Basic Control 0700 -1600 (26DegC) • Pre-Heat 1600 – 0000 (12DegC)
Seasonal Demands • Typical winter
Seasonal Demands • Typical spring
Seasonal Demands • Typical summer
Automatic Control System • Sensors • Computer Network • Controlling each room separately
Supply • Wind Energy 30KW • PV Solar 40KW • Generator 50 KW • Battery x 10 • Nominal Voltage 4V • Nominal Capacity 7.6 KWh
Component Production Fraction (kWh/yr) • PV array 63,462 27% • Wind turbine 57,946 25% • Generator 1112,359 48% • Total 233,766 100%
Annual electric energy consumption • Total Electrical Demand 173,310 kWh/yr • Excess electricity:60,456kWh/yr
Emissions without Renewable (kg/yr) • Carbon dioxide 260,993 • Carbon monoxide 644 • Unburned hydrocarbons 71.4 • Particulate matter 48.6 • Sulfur dioxide 524 • Nitrogen oxides 5,748
Emissions after embedding Renewables Emissions down by approx 50% (kg/yr) • Carbon dioxide 136,379 • Carbon monoxide 337 • Unburned hydrocarbons 37.3 • Particulate matter 25.4 • Sulfur dioxide 274 • Nitrogen oxides 3,004
Assumptions • Wind and Solar Data are estimated for urban areas (lack of information available) • Cost is not taken in consideration • Demands are assumed to be of a typical office
Conclusion • Heating demands has been reduced by approx 20% • Electrical demands has been reduced by 10% • Embedding Renewable generation reduced emissions by more than 50 %
Thank you for your attention Any Questions?
Crit 4 (Final Presentation) Your team should be reporting the outcomes from the year's investigation. These should include a • summary of how and where energy savings have been achieved, • an assessment of the improvements to building performance, • reduction in plant capacity and the reduced environmental impact achieved by adopting the plant and control procedures used.