
Introduction
Figure 4 - BTEX Separation. Figure 1 - Plunger Position of Diaphragm Valve. a.). b.). Picture taken from works by Pawliszyn. Figure 3 - SPME Device.

Introduction
E N D
Presentation Transcript
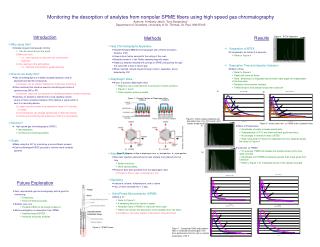
Figure 4 - BTEX Separation Figure 1 - Plunger Position of Diaphragm Valve a.) b.) Picture taken from works by Pawliszyn Figure 3 - SPME Device Monitoring the desorption of analytes from nonpolar SPME fibers using high speed gas chromatographyAuthors: Kimberly Jasch, Tony Borgerding*Department of Chemistry, University of St. Thomas, St. Paul, MN 55105 Introduction Methods Results • Why study this? • Volatile Organic Compounds (VOCs) • Can be found all over the world • Many are toxic • i.e. over exposure to benzene can contribute to leukemia • Very reactive in the atmosphere • i.e. methane contributes to global warming • How do we study this? • Gas chromatography is a widely accepted practice used to separate and identify compounds. • However, not an efficient method for continuous monitoring. • Other methods that could be used for monitoring are forms of spectroscopy (MS or IR). • However, these are not practical for identifying between similar molecules. • Typically, an analyte is injected into a long capillary column where a Flame Ionization Detector (FID) detects a signal which is sent to a recording device. • Longer columns means long separation times of 15 minutes or longer • Concentrations can change significantly in that time interval • Continuous monitoring the presence of VOCs is not possible • Solution? • High speed gas chromatography (HSGC) • fast separation • continuous monitoring possible • Goals • Make using the GC for monitoring a more efficient process • Use the developed HSGC process to monitor more complex systems • Gas Chromatography Apparatus • Hewlett Packard 5890A Chromatograph with a Flame Ionization Detector (FID) • Uses a 6-port valve secured to the ceiling of the oven • Samples made in 1-liter Tedlar sampling bag with septa • Gaseous samples injected with syringe or SPME and pushed through the valve with a flow of helium gas. • When injected, sample travels through column, separates, and is detected by FID • Diaphragm Valve • 6-port, 2-position diaphragm valve. • Requires only a small amount of pressure to switch positions • Figures 1 and 2 • Quick injection pulses possible • Injection Pulse • Narrower injection pulse allows for less sample to be placed into the loop • Better resolution • More reproducibility • Pulses of 6ms were possible from the diaphragm valve • Pulses of 5ms or less, consistency is lost • Sampling • benzene, toluene, ethylbenzene, and o-xylene • 8L of each syringed into 1-L bag • Solid-Phase Microextractor (SPME) • What is it? • Refer to Figure 3 • A sampling device for liquids or gases • Nonpolar fibers of PDMS or Carboxen were used • HSGC can monitor the desorption of the analytes from the fibers • Limitations: not many studies of desorption time performed • Separation of BTEX • Completed in as fast as 5.4 seconds • Refer to Figure 4 • Desorption Time and Injection Variation • Effect of Flow • Refer to Figure 5 • Peaks will come off faster • Note: differences in integrated results within each graph are independent of the flow rates • Retention times remain constant • PDMS tends to hold analyte longer than carboxen • Effect of Temperature • Amplitudes of peaks increase significantly • Temperatures of 70˚C and lower will have good resolution. • No changes in retention times of BTEX • Note: each peak in Figure 6 is separated into four separate peaks like those in Figure 4 • Carboxen vs. PDMS • On average, PDMS will release the analyte slower as the flow rates increase • Amplitudes from PDMS consistently greater than those given from Carboxen • Refer to Figure 7 for integrated results of the signals recorded a.) b.) Picture taken from Valco catalogue Figure 6 - Effect of peak amplitude and desorption time of a.) 70˚C and b.) 40˚C injector temperature Figure 5 - Various flows with a.) PDMS and b.) carboxen fibers. Picture taken from Valco catalogue a.) b.) Figure 2 - Direction of flow in diaphragm valve a.) load position, b.) inject position Future Exploration • Fast, reproducible gas chromatography will be good for monitoring: • Extractions • Environmental processes • Smaller oven unit • Portable HSGC to be brought outdoors • More investigation on desorption from SPME • Analytes beyond BTEX • Nonpolar and polar analytes Figure 7 - Comparing PDMS and carboxen fibers in amplitudesand desorption time. Runs performed at 5mL/min with an injector temperature of 30˚C.


