Consumer Surplus and Producer Surplus
310 likes | 915 Vues
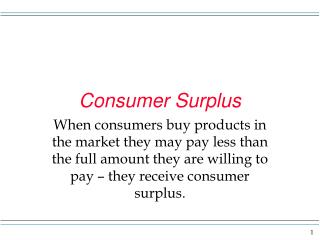
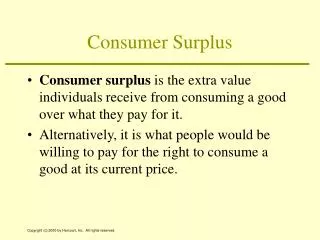
Learning Objective 4.1. Consumer Surplus and Producer Surplus. Consumer Surplus. Consumer surplus The difference between the highest price a consumer is willing to pay and the price the consumer actually pays.

Consumer Surplus and Producer Surplus
E N D
Presentation Transcript
Learning Objective 4.1 Consumer Surplus and Producer Surplus • Consumer Surplus Consumer surplusThe difference between the highest price a consumer is willing to pay and the price the consumer actually pays. Marginal benefitThe additional benefit to a consumer from consuming one more unit of a good or service.
Learning Objective 4.1 Consumer Surplus and Producer Surplus • Consumer Surplus FIGURE 4-1 Deriving the Demand Curve for Chai Tea
Learning Objective 4.1 Consumer Surplus and Producer Surplus • Consumer Surplus FIGURE 4-2 Measuring Consumer Surplus
Learning Objective 4.1 Consumer Surplus and Producer Surplus Consumer Surplus FIGURE 4-3 Total Consumer Surplus in the Market for Chai Tea
Learning Objective 4.1 MakingtheConnection • The Consumer Surplus fromSatellite Television Consumer surplus allows us to measure the benefit consumers receive in excess of the price they paid to purchase a product.
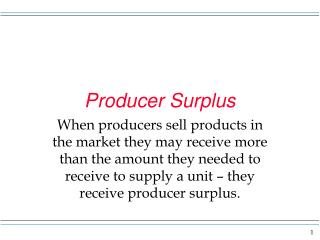
Learning Objective 4.1 Consumer Surplus and Producer Surplus • Producer Surplus Marginal cost The additional cost to a firm of producing one more unit of a good or service. Producer surplus The difference between the lowest price a firm would have been willing to accept and the price it actually receives.
Learning Objective 4.1 Consumer Surplus and Producer Surplus • Producer Surplus FIGURE 4-4 Calculating Producer Surplus
Learning Objective 4.1 Consumer Surplus and Producer Surplus • What Consumer Surplus and Producer Surplus Measure Consumer surplus measures the net benefit to consumers from participating in a market rather than the total benefit. The net benefit equals the total benefit received by consumers minus the total amount they must pay to buy the good. Producer surplus measures the net benefit received by producers from participating in a market. Producer surplus is the total amount firms receive from consumers minus the cost of producing the good.
Learning Objective 4.2 The Efficiency of Competitive Markets Marginal Benefit Equals Marginal Cost in Competitive Equilibrium FIGURE 4-5 Marginal Benefit Equals Marginal CostOnly at Competitive Equilibrium
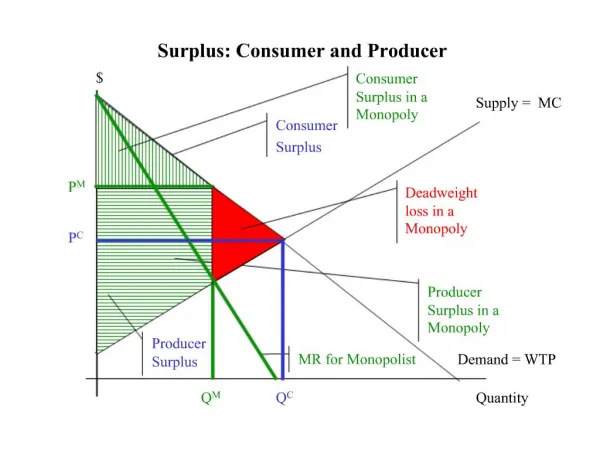
Economic surplus The sum of consumer surplus and producer surplus. Figure 4.6 Economic Surplus Equals the Sum of Consumer Surplus and Producer Surplus The economic surplus in a market is the sum of the blue area, representing consumer surplus, and the red area, representing producer surplus. Equilibrium in a competitive market results in the greatest amount of economic surplus, or total net benefit to society, from the production of a good or service. Economic efficiency A market outcome in which the marginal benefit to consumers of the last unit produced is equal to its marginal cost of production and in which the sum of consumer surplus and producer surplus is at a maximum.
Learning Objective 4.2 The Efficiency of Competitive Markets Deadweight Loss FIGURE 4-7 When a Market Is Not in Equilibrium There is a Deadweight Loss Deadweight loss The reduction in economic surplus resulting from a market not being in competitive equilibrium.
Learning Objective 4.2 The Efficiency of Competitive Markets Economic Surplus and Economic Efficiency Economic efficiency A market outcome in which the marginal benefit to consumers of the last unit produced is equal to its marginal cost of production, and in which the sum of consumer surplus and producer surplus is at a maximum.
Economic Efficiency, Government Price Setting, and Taxes • Price ceiling A legally determined maximum price that sellers may charge. • Price floorA legally determined minimum price that sellers may receive.
Learning Objective 4.3 Government Intervention in the Market:Price Floors And Price Ceilings Price Floors: Government Policy in Agricultural Markets FIGURE 4-8 The Economic Effect of a Price Floor in the Wheat Market
Learning Objective 4.3 MakingtheConnection • Price Floors in Labor Markets: The Debate Over Minimum Wage Policy
Learning Objective 4.3 Government Intervention in the Market:Price Floors And Price Ceilings Price Ceilings: Government Rent Control Policy in Housing Markets FIGURE 4-9 The Economic Effect of a Rent Ceiling Don’t Let This Happen to YOU!Don’t Confuse “Scarcity” with a “Shortage”
Learning Objective 4.3 Government Intervention in the Market:Price Floors And Price Ceilings The Results of Government Price Controls: Winners, Losers, and Inefficiency • When the government imposes price floors or price ceilings, three important results occur: • Some people win. • Some people lose. • There is a loss of economic efficiency.
Learning Objective 4.3 Government Intervention in the Market:Price Floors And Price Ceilings Positive and Normative Analysis of Price Ceilings and Price Floors • Whether rent controls or federal farm programs are desirable or undesirable is a normative question. • Whether the gains to the winners more than make up for the losses to the losers and for the decline in economic efficiency is a matter of judgment and not strictly an economic question.
Learning Objective 4.4 The Economic Impact of Taxes The Effect of Taxes on Economic Efficiency FIGURE 4-10 The Effect of a Tax on the Market for Cigarettes
Learning Objective 4.4 The Economic Impact of Taxes Tax Incidence: Who Actually Pays a Tax? Tax incidence The actual division of the burden of a tax between buyers and sellers in a market.
Learning Objective 4.4 The Economic Impact of Taxes Tax Incidence: Who Actually Pays a Tax? Determining Tax Incidence on a Demand and Supply Graph FIGURE 4-11 The Incidence of a Tax on Gasoline
Learning Objective 4.4 The Economic Impact of Taxes Tax Incidence: Who Actually Pays a Tax? Does It Matter Whether the Tax Is on Buyers or Sellers? FIGURE 4-12 The Incidence of a Tax on Gasoline Paid by Buyers
Learning Objective 4.4 4-4 Solved Problem When Do Consumers Pay All of a Sales Tax Increase?
Learning Objective 4.4 MakingtheConnection • Is the Burden of the Social Security Tax Really Shared Equally between Workers and Firms?
K e y T e r m s Consumer surplus Deadweight loss Economic efficiency Economic surplus Marginal benefit Marginal cost Price ceiling Price floor Producer surplus Tax incidence