Download
1 / 1
10 likes | 124 Vues
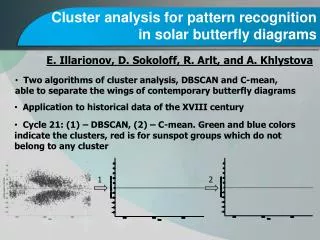
This study presents two cluster analysis algorithms, DBSCAN and C-mean, designed to effectively separate the wings of contemporary butterfly diagrams. The methods are applied to historical solar activity data from the 18th century, illustrating their utility in recognizing patterns in solar phenomena. The visual output distinguishes clusters using green and blue colors, while red represents sunspot groups excluded from any cluster. This research contributes to our understanding of solar cycles and their historical patterns.

E N D
Cluster analysis for pattern recognition in solar butterfly diagrams E. Illarionov, D. Sokoloff, R. Arlt, andA. Khlystova • Two algorithms of cluster analysis, DBSCAN and C-mean, able to separate the wings of contemporary butterfly diagrams • Application to historical data of the XVIII century • Cycle 21: (1) – DBSCAN, (2) – C-mean. Green and blue colors indicate the clusters, red is for sunspot groups which do not belong to any cluster 1 2