Global Monsoon Rainfall Intensity Shows Downward Trend
10 likes | 163 Vues
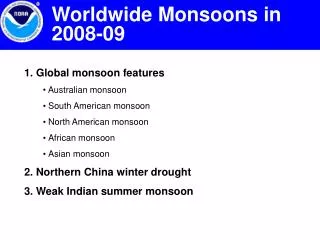
Recent research by Pang-chi Hsu, Tim Li, and Bin Wang reveals an intriguing trend in global monsoon rainfall intensity. The study, centered on varying atmospheric conditions and surface temperatures, defines the Global Monsoon Area (GMA) as regions where summer-minus-winter rainfall exceeds 2mm/day. Analysis of datasets from GPCP and CMAP indicates an overall increase in GMA and total precipitation from 1979 to 2008. However, both datasets reveal a consistent downward trend in the Global Monsoon Intensity Index (GMI), primarily attributed to reduced rainfall over land and ocean.

Global Monsoon Rainfall Intensity Shows Downward Trend
E N D
Presentation Transcript
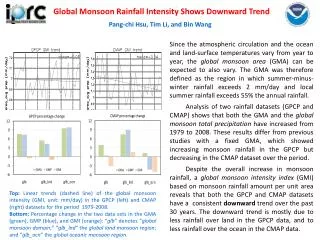
Global Monsoon Rainfall Intensity Shows Downward Trend Pang-chi Hsu, Tim Li, and Bin Wang Since the atmospheric circulation and the ocean and land-surface temperatures vary from year to year, the global monsoon area (GMA) can be expected to also vary. The GMA was therefore defined as the region in which summer-minus-winter rainfall exceeds 2 mm/day and local summer rainfall exceeds 55% the annual rainfall. Analysis of two rainfall datasets (GPCP and CMAP) shows that both the GMA and the global monsoon total precipitation have increased from 1979 to 2008. These results differ from previous studies with a fixed GMA, which showed increasing monsoon rainfall in the GPCP but decreasing in the CMAP dataset over the period. Despite the overall increase in monsoon rainfall, a global monsoon intensity index (GMI) based on monsoon rainfall amount per unit area reveals that both the GPCP and CMAP datasets have a consistent downward trend over the past 30 years. The downward trend is mostly due to less rainfall over land in the GPCP data, and to less rainfall over the ocean in the CMAP data. Top: Linear trends (dashed line) of the global monsoon intensity (GMI, unit: mm/day) in the GPCP (left) and CMAP (right) datasets for the period 1979-2008. Bottom: Percentage change in the two data sets in the GMA (green), GMP (blue), and GMI (orange): “glb” denotes “global monsoon domain;” “glb_lnd” the global land monsoon region; and “glb_ocn” the global oceanic monsoon region.