
Heat Map Analysis of Sensation Modality from Electrocutaneous Stimulation in Subjects
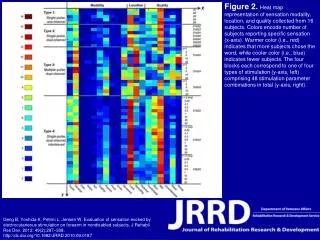
This heat map illustrates the sensation modalities, locations, and qualities experienced by 16 subjects during electrocutaneous stimulation. The x-axis represents the number of subjects reporting specific sensations, with warmer colors (red) indicating more reports and cooler colors (blue) indicating fewer. The y-axis categorizes the data into four stimulation types, encompassing a total of 48 stimulation parameter combinations. This research enhances our understanding of evoked sensations in non-disabled individuals, as detailed in the study by Geng et al. (2012).

Heat Map Analysis of Sensation Modality from Electrocutaneous Stimulation in Subjects
E N D
Presentation Transcript
Figure 2. Heat map representation of sensation modality, location, and quality collected from 16 subjects. Colors encode number of subjects reporting specific sensation (x-axis). Warmer color (i.e., red) indicates that more subjects chose the word, while cooler color (i.e., blue) indicates fewer subjects. The four blocks each correspond to one of four types of stimulation (y-axis, left) comprising 48 stimulation parameter combinations in total (y-axis, right). Geng B, Yoshida K, Petrini L, Jensen W. Evaluation of sensation evoked by electrocutaneous stimulation on forearm in nondisabled subjects. J Rehabil Res Dev. 2012; 49(2):297–308. http://dx.doi.org/10.1682/JRRD.2010.09.0187