2011 Census Analysis programme aims, analyses released so far & upcoming plans
280 likes | 297 Vues
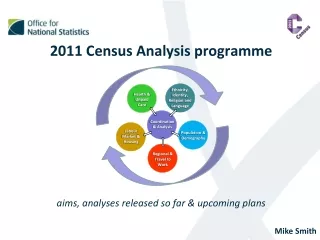
This program aims to analyze and coordinate data related to ethnicity, identity, religion, and language from the 2011 Census. It focuses on health and unpaid care, regional travel to work, population and demography, and labor market and housing. The analysis aims to inform government policy and public debate and provide a one-stop shop for census analyses.

2011 Census Analysis programme aims, analyses released so far & upcoming plans
E N D
Presentation Transcript
Coordination & Analysis Ethnicity, Identity, Religion and Language Health & Unpaid Care Regional & Travel to Work 2011 Census Analysis programmeaims, analyses released so far & upcoming plans Labour Market & Housing Population & Demography Mike Smith
Census Data - remaining releases • Small populations • For small number of communities • Key characteristics by LA where size passes minimum threshold (200 people) • UK Migration tables – Scottish data now added
. . and Microdata Published Jan 2014 December 2014 Now available
. . . and Origin-Destination Published July 2014 From now . . . From end Nov . . .
Some new tools to help you... • ONS Data Explorer (Beta) • New functionality on the ONS website to enable users to: • ONS Open API (Beta) • Provides capability for others to more easily build and develop applications that use ONS data • Find out more about both tools: • http://www.ons.gov.uk/ons/guide-method/census/2011/census-data/ons-data-explorer-beta-/index.html 1. Find datasets 2. Use datasets – How you want • Refine to only include topics and areas you want • Customise datasets to your requirements • Download and/or view on-line or By Topic By Area
Aims of the work programme Maximising the benefits of Census 2011 • Produce timely and relevant census analyses • Aid understanding and interpretation of census data • Improve the usability of Census 2011 • Provide a springboard for analyses by other organisations • Inform government policy and public debate • Establish a Centre for Census Analysis • One-stop shop for Census Analyses by ONS and other organisations
Produce timely and relevant census analyses • Groundwork for analysis laid during 2011 Census consultation • In-depth consultation including sharing of initial analysis plans • User Consultation - the known, knowns • Word of mouth - the known, unknowns • Internet discussion forums - the unknown, unknowns! • Ongoing discussions to meet evolving public debate and policy landscape • Regular meetings with academia, OGDs, local government • Workshops held annually across England and Wales to discuss plans & requirements with users • 64 Publications since December 2012 – averaging around 3 per month
General Health General Health A useful indicator of general well-being and health-related quality of life Snapshot 81.2 % of people reported ‘Good’ Health 15.5% gap in ‘Good’ health between Hart (88.1%) and Blaenau Gwent (72.6%) 18 to 20 year gap in Healthy Life Expectancy (HLE) across NHS Clinical Commissioning Groups (CCGs) NHS Guildford and Waverley; 70.3 years for males and 71.3 for females NHS Bradford City; 52.5 years for males and 51.6 for females Ethnic variations in General Health and unpaid care Inequality in general heath and in the provision of unpaid care between ethnic groups The largest health gaps between socio-economic groups are found in big cities Islington had the largest health gaps for both men and women Strong relationship between health and area deprivation Highest percentages of ‘Good’ health clustered to the south and west of London in 2011 Healthy Life Expectancy Variation across Clinical Care Commissioning Groups The link between disadvantage and health status is strongest amongst the middle aged Health and disability in the most and least disadvantaged areas in England
Disability Disability Activity limiting health problems or disabilities Snapshot 10 Million+ with Activity Limiting Illness in England and Wales Lowest in Wandsworth (11.2%), highest in Neath and Port Talbot (28.0%) Higher rates of disability in class 7 (routine) compared to class 1 (managerial and professional) occupations 15 to 16 year gap in Disability Free Life Expectancy across NHS Clinical Commissioning Groups (CCGs) The proportion of people reporting that their activities were limited Around a fifth of residents reported they had some form of activity limitation in 2011 Severe Disabilities may be restricting people’s access to top jobs and careers Higher managerial and professional occupations had the lowest proportion of workers with severe disabilities in 2011 What does the 2011 census tell us about health and disability? How age and area influence 'Good' health among disabled people. Females live longer than males but spend a longer proportion of their lives with a disability People in the South of England have higher disability-free life expectancy than those in the North
Social Care Unpaid Care The number of unpaid carers and the extent of care they provide Snapshot More than 1 in 10 provide unpaid care Lowest in Wandsworth (6.5%), highest in Neath and Port Talbot (14.6%) The majority (58%) of unpaid carers were women Carers are themselves more likely to be in ‘Not Good’ health Young unpaid carers providing care for 50 or more hours a week were up to 5.9 times more likely than those providing no care to report ‘Not Good’ general health Gender gap in unpaid care Provision of unpaid care and how this varied by sex, age, region and economic activity Providing unpaid care may have an adverse affect on young carers health Unpaid care provision by 5 to 17-year-olds Unpaid Care expectancies across Clinical Commissioning Groups New insight into different patterns of care provision by men and women across geographical areas Changes in the Older Resident Care Home Population between 2001 and 2011 Small changes in the numbers hide an underlying shift in the age structure and sex of this population
Social Care Unpaid Care expectancies across Clinical Commissioning Groups New insight into different patterns of care provision by men and women across geographical areas
Older People and Alternative Populations Snapshot 1 million more people aged 65 and above in 2011 compared to 2001 – proportion remained stable at 16% The population aged 85 and over increased by a quarter of a million, to 1.25 million The workday population increased 56 fold in City of London - Increases in excess of 100,000 were seen in Westminster, City of London, Camden, Tower Hamlets and Manchester 49% of the workplace population in London had a level 4 (degree) qualification or higher Leeds, Manchester, Nottingham and Sheffield had out of term populations more than 20,000 lower than their usually resident populations What does the Census tell us about Older People? The characteristics of older people (those aged 65 and over) What does the Census tell us about the Oldest Old? The characteristics of people aged 85 and over The workday Population of England and Wales The workday population by age, sex and geographical breakdown Analysis of the Workplace Population Workplace location, including use of the new workplace zone geography The Out of Term Population of England and Wales Compares Out-of-Term and usual resident populations
Families and Households Families Data on Families and Households Snapshot 23.4 million households in 2011 90% of lone parent households were headed by a woman 11% of couple families with dependant children had at least one stepchild Average Household size has remained fairly stable over the last thirty years, 2.36 people in England and 2.31 in Wales Concealed families (families living in multi-family households with the primary family) increased by 70% between 2001 and 2011 – most common in Brent and Newham at approx. 10% Stepfamilies, 2011 Stepfamilies and children in stepfamilies Households and Household Composition A summary of households and usual residents living in households How have Living Arrangements and Marital Status changed since 2001? Marital status and Living Arrangements How do Living Arrangements, Family Type and Family Size vary? The distribution of family types and the interaction with family size. What does the Census tell us about Concealed Families living in multi-family households? A summary of concealed families Dependant Children with a Parental Second Address Dependent children who shared their time between two different parental addresses Childbearing of UK and Non-UK born women Fertility patterns for specific non-UK countries of birth
Families and Households How have Living Arrangements and Marital Status changed since 2001? Marital status and Living Arrangements
Housing Housing A century of home ownership and renting in England and Wales Snapshot Home ownership has risen from just 23% in 1918 to 64% in 2011 – although the peak was in 2001 at 69% Social renting peaked at 36% in 1981, but was equal to private renting at 18% in 2011 1.1 million households were overcrowded in 2011. In Newham, more than a quarter were overcrowded Excluding London, 70% of all households had at least one spare bedroom Bangladeshi ‘s had a higher proportion of overcrowded households than any other ethnic group. Home Ownership and Renting in England and Wales An examination of housing tenure by size of household, number of bedrooms and characteristics of the household reference person (HRP) Census Suggests over 1.1 million households in England and Wales were overcrowded Census analysis on occupancy ratings by household type Household Overcrowding and Under-Occupation by Ethnic Group Comparison of Bedroom Occupancy Rating data for different Ethnic Groups of Household Representative Person
Ethnicity, National Identity and Language Ethnicity and National Identity England and Wales has become more ethnically diverse with rising numbers of people identifying with minority ethnic groups in 2011 Snapshot Gypsy or Irish Travellers were the smallest ethnic group (with a tick box) (58,000 people) 22% of people in London had a main language other than English Almost 9% of people in Newham could not speak English well or at all People who were ‘non-proficient’ in English had worse self-rated health Almost 45% of people who were ‘non-proficient’ in English were economically inactive compared to 22% amongst those with English as main language Gypsy or Irish Travellers Smallest Ethnic Minority at 58,000 Census analysis looks at how Gypsy or Irish Travellers live in England and Wales What does the 2011 Census tell us about Inter-Ethnic relationships 9% of people who were living as part of a couple were in an inter-ethnic relationship in England and Wales in 2011 Language Over 9 in 10 people reported English (English or Welsh in Wales) as their main language in March 2011 Those proficient in English are more likely to report ‘Good’ Health 2011 Census analysis of English language proficiency in England and Wales People who could not speak English well or at all had a lower level of employment English language proficiency in the labour market
Religion Snapshot 59% of usual resident population were Christian - a fall of 12 percentage points since 2001 Almost 81% of people in Knowsley were Christian. 5% were Muslim, a 2 percentage point increase since 2001 More than a third (34.5%) of people in Tower Hamlets were Muslim 25% reported no religion, a 10 percentage point increase since 2001 More than 42% of people in Norwich reported no religion. Religion Christianity remains the largest religion in England and Wales in 2011 What does the census tell us about Religion in 2011 Changing religious affiliations in England and Wales
Migration International Migrants Different types of migrants and their socio-economic outcomes, down to low geographic levels Snapshot 13%, 7.5 million usual residents were born outside of the UK The ten local authorities with the highest proportions of both non-UK born and non-UK nationals in their resident population were London boroughs 55% of Short term residents were full time students 38% of foreign nationals were qualified at level 4+ (degree or higher) compared to 29% of UK nationals Half (3.8 million) of the usually resident foreign-born population in England and Wales in 2011 came to the UK in the ten years prior to the 2011 Census; however, around a quarter had been resident in the UK for over 30 years Non-UK born short-term residents Data on non-UK born short-term residents (STRs) from the 2011 Census for England and Wales Country of Birth and Nationality analysis Two key measures of the migrant population of England and Wales, specifically country of birth and passports held Immigration patterns of Non-UK born populations The immigration patterns of non-UK born residents of England and Wales using 2011 and historic census data Economic and Social Characteristics by nationality and country of birth Economic activity, occupation and industry, qualifications, English language proficiency, housing tenure and health Internal and International Migration of Older Residents People Aged 65 and Over who were living at a different address one year prior to the census Social and Economic Characteristics by Length of Residence of Migrant Populations Nationality, economic activity, qualifications, occupation, housing tenure, Language proficiency and national identity
Migration Immigration patterns of Non-UK born populations The immigration patterns of non-UK born residents of England and Wales using 2011 and historic census data
Labour Market and Qualifications Labour Market Differences between the 2011 Census and the LFS Snapshot In 1841, 36% of workforce was in Manufacturing and 33% in Services. In 2011, just 9% worked in manufacturing and 81% in Services More than a quarter of residents of Blenau Gwent and Merthyr Tydfil had no qualifications 67% of people in Eden were employed despite having no qualifications, compared to 30% employment amongst this group in Tower Hamlets 5 areas with the greatest proportion of people with a level 4+ (degree or higher) qualification were in London 170 Years of Industrial Change Changes in the proportion of people employed in different industries since 1841 and some of the factors driving it Labour Market Participation Local area analysis using the 2011 Census Characteristics of Home Workers across the UK Home workers in the UK using data from the APS/LFS and the 2011 Census Ethnicity and the Labour Market patterns of economic activity vary widely across different ethnic minority groups Qualifications, comparison of 2011 Census and APS/LFS Differences in qualifications estimates between the 2011 Census and the APS/LFS Fewer than half of those with no qualifications were in Employment Census analysis of the value of different levels of qualification in the labour market Over 4 in 10 aged 25 to 34 had a degree level or above qualification Highest level of qualifications in England and Wales in 2011
Travel to Work and other geographical analyses Travel to Work Examines the key findings from the 2011 Census on methods of travel to work in England and Wales for the working population aged 16 to 74 Snapshot 57.5% of the working population drive to work Newham had the highest proportion commuting to work by public transport (65.5%) Average commuting distances increased from 13.4km in 2001 to 15.0km in 2011 Cycling to work more than doubled in Inner London and Brighton and Hove between 2001 and 2011 More than 1 in 8 household spaces in National Parks had no usual residents (holiday homes, second residences etc) Portishead had highest employment rate (81%) Commuters Travelling Longer Distances to Work The distance travelled to work by commuters and changing commuting patterns Growth in Cycling in the Major Cities Looks at who cycles to work, in what parts of country, and changes since 2001 Commuting Patterns in the UK Exploring the census 2011 origin-destination data National Parks The 2011 Census provides an insight into the characteristics of the 13 national parks in England and Wales Characteristics of Built-Up Areas Comparing characteristics of usual residents and households in built-up and non built-up areas The Rural Population of England and Wales was 10.3 Million in 2011 Analysis of rural-urban characteristics Coastal Communities Key Data on 273 Coastal Communities
Social Media metrics Ethnic variations in general health & unpaid care provision • Key Points • There were 4 tweets on the release posted from the ONS channel. In total these received 14 retweets and they resulted in 75 ‘click throughs’ to the ONS website. The link to the infographic received more clicks (47) than the release (25) • The link to the ONS release was also the most popular link that featured in other users tweets, with some tweets (such as Mark Easton’s) including a chart from the release
How to link in your analyses • Contact the census analysis team • census.analysis.inbox@ons.gsi.gov.uk • Please provide: • Link to the website • Short synopsis of the piece of analytical work
Census Analysis Contacts Central Team michael.p.smith@ons.gsi.gov.uk census.analysis.inbox@ons.gsi.gov.uk Analysis leads Health and Social Care chris.white@ons.gsi.gov.uk Labour market incl. housing & qualifications matthew.penfold@ons.gsi.gov.uk Ethnicity, Identity, Religion & Language Angela.potter-collins@ons.gsi.gov.uk • Population and migration • chris.w.smith@ons.gsi.gov.uk • Regional and travel to work • richard.prothero@ons.gsi.gov.uk