Download
1 / 24
240 likes | 451 Vues
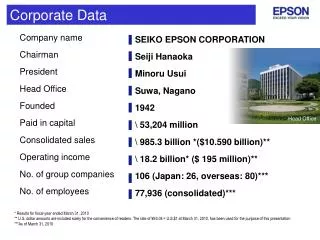
Tricorn Preliminary Results For year ended 31st March 2011. June 2011 Mike Welburn, Chief Executive Officer Phil Lee, Group Finance Director. Agenda. Results Overview Introduction to Tricorn Financial Review Business Performance Outlook. Results Overview. Results Overview.

E N D
Tricorn Preliminary ResultsFor year ended 31st March 2011 June 2011 Mike Welburn, Chief Executive Officer Phil Lee, Group Finance Director
Agenda • Results Overview • Introduction to Tricorn • Financial Review • Business Performance • Outlook
Results Overview *- Before intangible asset amortisation, shared based payment charges, interest rate swap and foreign exchange derivative valuation.
Results Overview • 45% growth in revenue • Energy and Transportation divisions key drivers • Improving demand in Utilities • Aerospace revenues broadly flat • 95% improvement in operating margin • Reduced operational gearing • Gross margins maintained • 3.2x increase in adjusted EPS • Significantly strengthened balance sheet • Net debt reduced to £61k • Paid off £0.780m of debt in the year • Inventories maintained at last year’s levels • Cash and cash equivalents £1.6m at year end • Maiden dividend recommended
Introduction - Market Drivers • Industry Competitors • Limited number of competitors • Many sub scale to Tricorn • Focus is on niche markets with low batch sizes and high variety • Customers to Tricorn • Large customers provide access to global markets • Customers profitable-low credit risk • Switching costs high • High proportion of recurring income • Specialist nature of supply provides some resilience • Suppliers to Tricorn • LCC sourcing • Commodity materials • Alternative sources • Switching costs low • Potential Entrants • Close customer relationships make it difficult for a start up to gain traction • Barriers to entry due to product approval process and complexity of supply • Product Substitutes • Specialised products; limited substitutes readily available • Conservative markets • Ability to source components at low cost acts as a deterrent 8
Introduction - Tricorn Strategy • To acquire and grow engineering-based businesses which:- • supply blue chip OEM customers • are focused on attractive end markets • have potential to deliver EBITDA margins of +10% • The key elements of this approach are to:- • find underperforming businesses • drive for operational excellence • improve margins through the implementation of lean manufacturing and low cost country component sourcing • service niche markets which offer healthy margin opportunities • increase market share 9
Financial Review-Headlines * - Before intangible asset amortisation, shared based payment charges, interest rate swap and foreign exchange derivative valuation.
Financial Review-Profitability • Improved operational gearing • Admin costs show a 12% improvement as a proportion of turnover • Operating profit margins* almost doubled versus last year * Before intangible asset amortisation, share based payment charges, interest rate swap and foreign exchange derivative valuation ** Includes a period of reduced working hours and associated reduced payroll costs
Financial Strength – Enabling Investment • Cash Generation:- • 94% Profit After Tax* to net cash flow generation in the year • Strong liquidity:- • Cash & equivalents increased 24% to £1.6m • > £1m headroom on invoice discounting facility • Term loan on course to be fully repaid by August 2012 • Net debt reduced to £61k (2010: £841k) • Focus on working capital:- • Control over inventory levels. Flat on significantly higher volumes • New investment commitments:- • In excess of £0.5m capital investment programmes already committed for delivery during 2011/12 • Building on existing plant capacity * - Before intangible asset amortisation, shared based payment charges, interest rate swap and foreign exchange derivative valuation.
Components of 2011 cashflow £000’s EBITDA £1,524k 2 20 (378) 458 (69) (132) 1,066 (187) 780 Capital expenditure Depreciation & interest charge Inventory reduction Other working capital movements Taxation Net interest paid Cashflow Proceeds from share issues Adjusted PBT
Business Review • Blue chip OEM customer base provides Tricorn with global reach • Revenue growth driven by market recovery and market share gains • Gross margins maintained despite some raw material price pressure and lower aerospace margins • Three out of four divisions met or exceeded 10% EBITDA target • Group Sales Director appointed to accelerate execution of organic growth plans
Energy Division • Sales up 81% on previous year • Strong recovery and market share gains • Capital investment being accelerated to meet on-going high demand levels • EBITDA margin significantly improved
4 5 3 2 Transportation Division • Sales up 53% on the previous year • Engineering team has introduced over 50 customer driven new products in the year • Next generation of fixtures have created further differentiation • Operational improvements have delivered an EBITDA margin of over 10%
Aerospace Division • Sales levels flat year on year • Margins impacted by supply chain constraints and higher material costs • Operational improvements and price increases to customers being sought • New divisional management team making good progress
Utilities Division • Revenue up 77% year on year • Focus on soil contamination issues may drive further demand • EBITDA margin remains strong
Outlook • Key markets remain buoyant • Additional opportunities for further market share gains • Higher level of investment being made in plant and equipment planned to continue through current year • Will consider potential acquisitions where Tricorn expertise can generate the necessary added value
Appendices 22
Shareholders 24