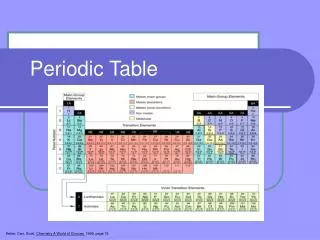
實驗數據分析與圖表製作 Data Anal. and Fig/Table Preps
實驗數據分析與圖表製作 Data Anal. and Fig/Table Preps. 2008 .生物產業機電工程特論 (8:40 – 9:30 am on Oct. 23, 2008). Lin-Chi Chen ( 陳林祈 ) Dept. of Bio-Industrial Mechatronics Eng., National Taiwan University Email: chenlinchi@ntu.edu.tw / Tel: 02-3366-5343. Structure of a Scientific Paper.


實驗數據分析與圖表製作 Data Anal. and Fig/Table Preps
E N D
Presentation Transcript
實驗數據分析與圖表製作Data Anal. and Fig/Table Preps 2008.生物產業機電工程特論 (8:40 – 9:30 am on Oct. 23, 2008) Lin-Chi Chen (陳林祈) Dept. of Bio-Industrial Mechatronics Eng., National Taiwan University Email: chenlinchi@ntu.edu.tw / Tel: 02-3366-5343
Structure of a Scientific Paper Most journals will require the same basic sections: Abstract (摘要) Introduction (導論) Background + Objective(s) Materials and Methods(研究方法) Results (結果) Discussion (討論) Conclusion(s) (結論) References (Literature Cited) (參考文獻) Tables, Figures, Figure Legends (圖、表及說明)
Planning for a Scientific Manuscript • Determine journal’s requirements (Instructions to Authors). • Length of manuscript • Number of illustrations/figures • Number of tables • Format of final submission • Check journal’s Web site or in journal itself for these and other specifications. • The manuscript should be sequential and logical, including: • Statement of problem (hypothesis) • Presentation of the evidence • Validity of the evidence • Implications of the evidence • Assessment of answer’s validity • Conclusion • Require Figures and Tables in Support of the “Findings”
How do nowadays newspapers present the figures and tables in support of the “stories” determined by the editor? 資料來源:蘋果日報
The way to present the figures and tables in support of the “findings” by scientific researchers is somewhat different. http://abacus.bates.edu/~ganderso/biology/resources/writing/HTWtablefigs.html
Three Forms of Data Presentation Text: contrary to what you may have heard, not all analyses or results warrant a Table or Figure. Some simple results are best stated in a single sentence, with data summarized parenthetically: Seed production was higher for plants in the full-sun treatment (52.3 +/-6.8 seeds) than for those receiving filtered light (14.7+/- 3.2 seeds, t=11.8, df=55, p<0.001.) Tables:Tables present or summarize lists of numbers or text in columns, each column having a title or label. Do not use a table when you wish to show a trend or a pattern of relationship between sets of values - these are better presented in a Figure. Figures:Figures are visual presentations of results, including graphs, diagrams, photos, drawings, schematics, maps, etc. Graphs are the most common type of figure. Graphs show trends or patterns of relationship.
How to Refer Tables and Figures How to refer to Tables and Figures from the text:Every Figure and Table included in the paper MUST be referred to from the text. Use sentences that draw the reader's attention to the relationship or trend you wish to highlight, referring to the appropriate Figure or Table only parenthetically: Ex.: Germination rates were significantly higher after 24 h in running water than in controls (Fig. 4). Ex.: DNA sequence homologies for the purple gene from the four congeners (Table 1) show high similarity, differing by at most 4 base pairs. Avoid sentences that give no information other than directing the reader to the Figure or Table: Ex.: Table 1 shows the summary results for male and female heights at Bates College.
Numbering, Placement, & Foolproof How to number Tables and Figures: Figures and Tables are numbered independently, in the sequence in which you refer to them in the text, starting with Figure 1 and Table 1. Placement of Figures and Tables within the Paper: In consideration of your readers, place each Table or Figure as near as possible to the place where you first refer to it (e.g., the next page.) For manuscripts (e.g. lab papers), Tables and Figures are usually put on separate pages from text material. The "Acid Test" for Tables and Figures: Any Table or Figure you present must be sufficiently clear, well-labeled, and described by its legend to be understood by your intended audience without reading the results section, i.e., it must be able to stand alone and be interpretable. Overly complicated Figures or Tables may be difficult to understand in or out of context, so strive for simplicity whenever possible. If you are unsure whether your tables or figures meet these criteria, give them to a fellow biology major (not in your course) and ask them to interpret your results.
Descriptive Legends and Captions • Descriptive Legends or Captions: To pass the "acid test" above, a clear and complete legend (sometimes called a caption) is essential. Like the title of the paper itself, each legend should convey as much information as possible about what the Table or Figure. Do not simply restate the axis labels with a "versus" written in between. • Example: Figure 1. Height frequency (%) of White Pines (Pinus strobus) at Thorncrag Bird Sanctuary, Lewiston, Maine, before and after the Ice Storm of '98. Before, n=137, after, n=133. Approximately 16% of canopy pines were topped by heavy ice loads, averaging 3.6 m stem length decrease. Four trees fell during the storm and were excluded from the post-storm survey. • Where do you place the legend? • Table legends go above the body of the Table and are left justified; Tables are read from the top down. • Figure legends go below the graph; graphs and other types of Figures are usually read from the bottom up.
Table Prep: Rule of Thumb • Determine journal’s limitations on number, style, or structure of tables. • Tables should be useful (not too simple) and easy to understand (not too complex). • Use tables when exact values are important. • Use tables when they are more efficient to summarize results than in long, complex sentences. • Tables with footnotes and abbreviations should be easily understandable. • General rule: 1 table per 1,000 words of text.
Anatomy of Table The typical layout of a table in three sections demarcated by lines.
Tables are most easily constructed using your word processor's table function or a spread sheet such as Excel. Gridlines or boxes, commonly invoked by word processors, are optional for our purposes, but unlikely to be permitted in a journal.
Example: Summary of Readings units are specified in column headings wherever appropriate
Figure Prep: Rule of Thumb • Types of illustrations: • Charts/graphs (bar graph, frequency histogram, XY scatter plot, XY line graph.) • Photographs (including X-rays, SEM, DNA/protein, image) • Line drawings (schematic illustration, instrumentation) • Use to provide evidence, emphasis, or efficiency. • As with tables, data in charts may be easier to understand than long statements of text. • Figures with legends and abbreviations should be easily understandable.
Figure Preparation (Cont’d) • Determine journal’s limitations on number, size, and types of figures/illustrations. • Black and white vs. color • Journal may not accept one or the other • Journal may charge for use of color • Resolution of images: typical requirements • At least 300 dpi for photographs • 1200 dpi for line art • May require glossy prints (hard copies) or specific electronic file types. • Label all figures according to journal’s specifications. • Clearly mark the correct orientation of the photograph. • Provide figure legends describing what is shown.
Photograph Example: DC Picture (Before charging) (Charging by PV) (Fully charged) (Removal of PV)
Photograph Example: Protein PAGE 70-100% AS 0-35% AS 1o Ammonium Sulfate Precipitation 2o Anion Exchange Chromatography 35-70% AS Done by Tzeng FEB 2005
Line Drawing: Schematic Illustration Daytime application: an IWECB-based window can be charged and colored by a photovoltaic cell (1) to store solar energy and (2) to attenuate solar irradiation. Nighttime application: an IWECB-based window can be discharged & bleached (1) to drive low-power devices and (2) to increase the illumination.
Alkaline Phosphatase (AP) Unreacted Substrate Streptavidin (SA) Reacted Substrate Biotin Aptamer Protein Surface for TP immobilization Combination of Figure Presentation Enzyme-Linked Immunosorbent Assay (ELISA) Typhoon scan / aptamer 5-fold dilution series Kd = 8 nM SA-Biotin interaction: Kd ~ 10-15 M = fM ~ ca. 260 pNt Aptamer with nM affinity confirmed
Frequently Used Software • Word • PowerPoint • CorelDraw • Photoshop • Excel • Origin • Grapher • SigmaPlot • Others…
A final and essential step for data presentation: consider the efficiency (do things right) and effectiveness (do the right things) Recall the model of “Apple Daily” Can you tell the difference between the figures in a rejected paper and an accepted paper? If you can’t, read more papers….
同學在論文圖表製作過程中常見違反學術倫理而不自覺的情事:直接剪貼網路(Internet)或文獻(PDF)圖片,但未經授權甚至未合理引用 (cf. 原文引用)製作漂亮數據或使用合成照片以滿足自己的結論未重複實驗僅報導成功一次的數據
Essence of Scientific Research A valuable thesis is based on the REPRODUCIBLE FACTS AND FIGURES and, the most importantly, YOUR OWN CREACTIONS, NOT NUMBER OF PAGES. http://www.cartoonstock.com/directory/s/scientist.asp