Understanding Probabilities in Physics: Analyzing Age Distribution in Groups
490 likes | 633 Vues
This slideshow by A. Albrecht presents a detailed exploration of probabilities related to age distributions in groups of people. With examples involving rooms of different sizes, it illustrates how to calculate probabilities for various age scenarios, including the impact of constraints like age < 20. Key lessons include normalization, re-normalization, and the importance of expectation values in probability distributions. By analyzing combinations of groups (e.g., red and blue rooms), it emphasizes intuitive applications of probability in physics contexts.

Understanding Probabilities in Physics: Analyzing Age Distribution in Groups
E N D
Presentation Transcript
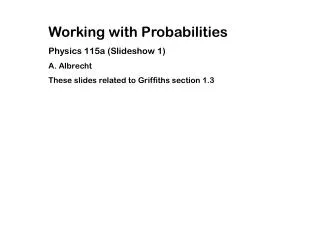
Working with Probabilities Physics 115a (Slideshow 1) A. Albrecht These slides related to Griffiths section 1.3
Consider the following group of people in a room: Total people = 14
Consider the following group of people in a room: Total people = 14
Consider the following group of people in a room: Total people = 14
Consider the following group of people in a room: Total people = 14
Consider the following group of people in a room: Total people = 14
Consider the following group of people in a room: Total people = 14
Consider the following group of people in a room: Total people = 14
NB: The probabilities for ages not listed are all zero Total people = 14
Assuming Age<20, what is the probability of finding each age? Total people = 14
Assuming Age<20, what is the probability of finding each age? Total people = 14
Assuming Age<20, what is the probability of finding each age? Total people = 14
Assuming no age constraint, what is the probability of finding each age? Related to collapse of the waveunction (“changing the question”) Total people = 14
Assuming Age<20, what is the probability of finding each age? Related to collapse of the waveunction (“changing the question”) Total people = 14
Consider a different room with different people: Total people = 15
Consider a different room with different people: Total people = 15
Combine Red and Blue rooms Total people = 29
Lessons so far • A simple application of probabilities • Normalization • “Re-Normalization” to answer a different question • Adding two “systems”. • All of the above are straightforward applications of intuition.
Most probable answer = 25 Median = 23 Average = 21
Most probable answer = 25 Median = 23 Average = 21 Lesson: Lots of different types of questions (some quite similar) with different answers. Details depend on the full probability distribution.
Average (mean): • Standard QM notation • Called “expectation value” • NB in general (including the above) the “expectation value” need not even be possible outcome.
Careful: In general In general, the average (or expectation value) of some function f(j) is
Continuous Variables Why not measure age in weeks?
Another case where a measure of age in weeks might by useful: The ages of students taking health in the 8th grade in a large school district (3000 students).