Download
1 / 49
490 likes | 496 Vues
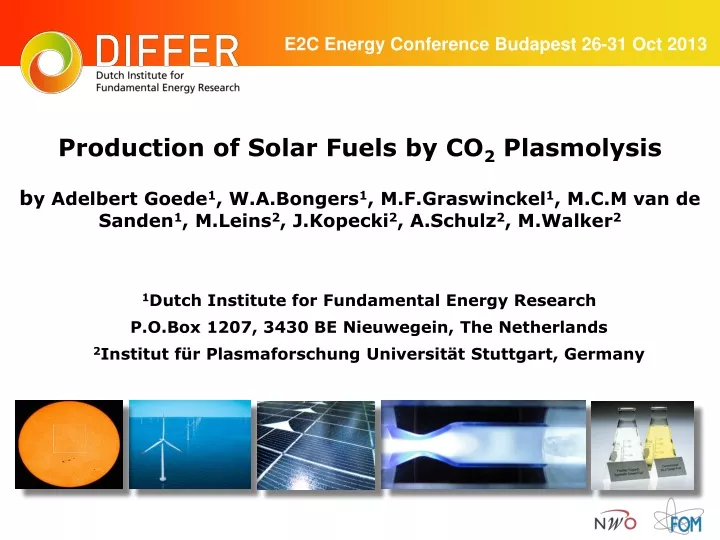
Production of Solar Fuels by CO 2 Plasmolysis b y Adelbert Goede 1 , W.A.Bongers 1 , M.F.Graswinckel 1 , M.C.M van de Sanden 1 , M.Leins 2 , J.Kopecki 2 , A.Schulz 2 , M.Walker 2. 1 Dutch Institute for Fundamental Energy Research P.O.Box 1207, 3430 BE Nieuwegein, The Netherlands

E N D
Production of Solar Fuels by CO2 Plasmolysisby Adelbert Goede1, W.A.Bongers1, M.F.Graswinckel1, M.C.M van de Sanden1, M.Leins2, J.Kopecki2, A.Schulz2, M.Walker2 1Dutch Institute for Fundamental Energy Research P.O.Box 1207, 3430 BE Nieuwegein, The Netherlands 2Institut für Plasmaforschung Universität Stuttgart, Germany E2C Energy Conference Budapest 26-31 Oct 2013
The Energy problem Why Solar Fuels? Fossil fuels, albeit finite, are still abundant in terms of world energy reserves: • Coal reserves 300 yrs (China) • Gas expanded from 50 to 200 yrs due to fracking shale beds • Oil demand has peaked in rich world • increased efficiency in petrol/diesel engines and emergence of hybrid and electric cars • switch to gas to power lorries, buses, ships and domestic/industrial heating systems What problem?
The Climate problem: IPCC 5th Assessment Problem is the CO2 emission from burning fossil fuel • Atmospheric concentration increased from 280ppm to 400ppm this year, • increased radiative forcing from 0.57 to 2.29 W/m2 since industrialisation • Result 0.5°C global average surface temperature rise • + 0.5°C due to climate inertia expected later this century • Most scientists & governments place 2°C limit on temp. rise • IPCC defines Carbon budget 1800 Gton CO2 emission (until 2011 539Gt, yearly 37 Gton global emission) • Budget will be spent by 2047 ±14yr (business as usual) • By 2069 ±18yr emission stabilisation (Nature 10 Oct 2013)
EU energy & climate policy • 2020 renewable share 20%, GHG emission reduction 20% • 2050 Roadmap GHG emission reduction 80-95% • To date 80% fossil fuel in EU energy mix Gas will play important role in energy transition: • CO2 emission 80% reduced compared with coal • Gas turbine allows rapid ramping up and down to compensate for intermittent supply by renewables • Gas storage provides reliable and flexible means to provide back-up power to compensate for low intermittent supply • Gas transport is factor 10 cheaper than electricity transport
Which Energy policy for France 2010-2050 Jean Louis Bobin, EuroPhysNews 44/1 2013 Wind power over Western Europe Jan-Feb 2011 by H.Flocard, J.P.Pervès) Peaks and troughs are correlated due to size of low pressure areas Installed wind capacity Europe 96 GW (2011)
Power to Gas & Carbon Capture and Usage One way to cope with intermittent supply and to enhance useful capacity • Power to Gas (P2G) to convert excess electricity generated by wind/solar power into hydro-carbon-based (solar) fuels • CO2 neutral power generation possible when CO2 emitted by burning these fuels is recaptured andreused(CCU) • Advantage: Existing infra structure for gas and oil storage, transport and distribution can be employed and enhanced
Grand Scheme Solar Fuels Methane Methanol CO2 Hydro-generation Sabatier Air (Reverse) Water Gas Shift CO RWGS CO2 Conversion by • Electro catalysis • Photo catalysis • Thermo catalysis • Plasma activation Point source H2 FT Fuel CO Fischer-Tropsch H2 water WGS Here focus on CO2 plasma activation Courtesy Wim Haije (ECN)
Why Plasma? Low temperature (Te~1eV, Ti~0.1eV) weakly ionised (10-5-10-6) gas as vehicle to ease conditions for splitting CO2 by creating conditions far from thermo-dynamic equilibrium • High energy efficiency (~60% demonstrated) • High power density (reduced size wrt electrolysis) • Rapid ramping up and down (wrt high temperature SOEC) • No scarce materials employed (Pt catalyst in PEM)
Out of equilibrium Tvib > T 0 chemistry Chemical reaction scheme CO2 -> CO + O (ΔH=5.5 eV) followed by reuse energeticOradical CO2 + O -> CO+ O2(ΔH=0.3 eV) Net CO2 -> CO + ½O2 (ΔH=2.9 eV) Efficiency to be increased by Concentration of electron energy on vibrational excitation of CO2 in asymmetric stretch mode λ=4.24-4.28 μm (750 THz, τ= 14 fs) n2 n2 n1 n3 Arrhenius/Fridman: Activation energy reduced by vibration energy k = A exp (αEv-Ea)/kT
Vibrational excitation as function of reduced electric field E/n ν3(001) asymmetric stretch mode @ E/n=2x10-16 Vcm2
Fridman plot: Energy Efficiency η against energy Ev per incoming CO2 molecule
Experiments at IPF Stuttgart Microwave input 30 kW @ 915 MHz High and low reduced electric field CO2 plasma Pump Mass Spectrometer
Type I discharge, Optical emission spectroscopy • CO third positives, fourth positives, Angstrom and triplet identified. • CO line intensity increases linear with power
Mass spectrometry CO produced at expense of CO2 CO2 flow 11.1 slm CO2>CO+½O2 CO αconversion CO2 O2 ηenergy eff h = DH/ECO
Lower reduced E field to enhance efficiency Gas flow • 10 mm symmetric nozzle at exit of RF cavity • RF input power 3020-8010 W • Gas pressure reaction chamber 190-250 mbar • Expansion chamber 0.3..0.4 mbar • Gas flow 75 slm CO2 • Energy spent per CO2 molecule 0.56..1.49 eV
Particle balance 2vB=n0<σv>r yields electron temperature through Bohm velocity vB=√(kTe/mi) gas density n0 up, discharge radius r down Energy balance PRF=nen0Σi<σv>Δεi V yields electron density and ionisation degree Typical ionisation degree ne/n0~10-5-10-6 Typical kTe~1-3eV,whilst Te~E/n where E/n ~2x10-16 corresponds to kTe~ 0.5 eV Hence conflicting requirement on ionization (Te >1eV) vs. vibrational excitation (Te< 1eV) Particle and energy balance
Conclusion and outlook Energy efficiency >50% obtained for 10% CO2 conversion through low temperature plasma activation. Next Physics steps: Diagnose the plasma: determine reduced electric field (incl. ne, Te, n0, T0) and vibration state CO2 (FTIR, Thomson scatter, CARS,..) Create super cooled gas stream T0~100K to lower vibration de-excitation Separate out flow CO from CO2 (low conversion factor) Next System steps: DIFFER experimental facility (1.3 kW 2.45 GHz) built 100 kW 915 MHz DIFFER facility planned Design and development of output gas separation system Interface with input CO2 capture Assess the economics
Energy Efficiency ηenergy Ev per incoming CO2 molecule and particle conversion ratio α η = H/Eco H=2.9 eV is the net enthalpy to produce CO Eco is the actual energy per molecule CO produced The fraction α of CO2 converted into CO defines the energy Ev per input CO2 mol. Ev = α Eco = (α/ η) H Hence, to increase efficiency η then lower Ev at conversion α
Flying start by DIFFER & IPF Cooperation Plasma by 915 MHz microwaves max 30 kW • CO produced at expense of CO2 Conversion CO CO2 ½O2 Energy • Measurements (solid) by mass spectrometry Constant CO2 flow of 11.1 SLM(2.3 kW@100% Energy efficiency)
Particle conversion α and energy efficiency η α= COout/CO2in = CO/(CO+CO2) W= NF/60x22.4 (eEv) [eV/s] = C (Ev/H) F [W] [1] Ico = aW; Ico2 = -aW + b and Io2 = ½ aW, yielding: [2] α= a/b W at fixed F [3] nE = H/Eco= H/(Ev/α)=α H/Ev=[Eq.3]=a/b W H/Ev= [Eq.1] = a/b CF Ev = (α/nE) H = 2.9 (α/nE) [eV]
Russian Experimental Results and recent DIFFER results Energy per incoming CO2 molecule to be around 0.4 eV
Optical Emission Spectroscopy • electronic transitions CO and C2 observed • Insight in vibrational excitation CO (and CO2) Expanding plasma at 0.8 mbar plasma pressure, high reduced E field CO 4th positive system, singlet transition A1Π>X1Σ CO 3th positive system, triplet transition b3Σ+ → a3Π CO ÅngströmB1S+ → A1P C2 Swan band of C2 A3Πg>X3Πu CO Triplet System d3Δ>a3Π CO2-, CO2+-, and CO+-bands as well as atomic carbon lines are not observed [Pearse and Gaydon]
Overview CO Spectra in UV and visible • Nozzle shape: hardly any difference observed • Nozzle dia. change: transition from type I to type II discharge, intensity x 100 • Nozzle position at entrance or exit, dramatic change in efficiency observed
Intensity [counts/ms] P = 5 kW, d = 5 mm asymm, position IV 1400 1200 1 cm 3 cm 1000 6 cm 800 600 400 200 0 200 300 400 500 600 700 wavelength [nm] Spectra type II discharge • Spectra dominated by Swan C2 band • Some atomic Oxygen and atomic carbon • Intensity factor 100 increase C2 Swan band A3Πg>X3Πu
Direct dissociation via 1B2 vibration mode produces singlet O1D atomic oxygen requiring ~8eV More efficient via 1B2 to 3B2 singlet triplet transition ~5.5eV. Atomic Oxygen triplet O3P derives from 5.5eV dissociation channel Resulting CO always in 1Σ+ ground state CO2 chemistry out of equilibrium Tv > T 0
cross section CO2 assym vibrational excitation • Vibration excitation of asymmetric stretch mode reaches maximum at electron energy 0.4 eV • 1/v dependence renders collision frequency independent of energy • At 3,8 eV there is a resonance in the cross section where bend and symmetric vibration mode exceed stretch mode
Cavity (12.4 cm) I II III V IV z Various nozzle positions/types explored Nozzle Positions • I z = -3 cm • II z = 0 cm • III z = 12.4 + 0 cm • IV z = 12.4 + 5 cm • V z = 12.4 + 3 cm Nozzle configurations/types: 1.Straight ( 26 mm)2.Symmetric ( 26 mm with 5 mm and 10 mm throat) 3.Laval ( 26 mm with 5 mm throat)4.Double nozzle (Laval combined with copper exit nozzle of 5 mm)
Sub-sonic and supersonic flow • Theoretically, V-T relaxation decreases exponentially with gas temperature. • Gas expansion by nozzle to lower gas temperature. • Choked flow (M=1) obtained in discharge region • Transition sub-sonic to super-sonic obtained by increase power at constant flow (gas temperature) • For choked flow vF = cs, the relation between temperature and pressure becomes: kT= γ/mi {pO/F}2
Understanding CO2 dissociation by plasma activation How to make sense out of these experiments? Answer: Reduced electric field Er=E/n turns out to be key One century old concept, yet not appreciated
Electron excitation CO2 vs electron energy vibrations excitation requires electron energy Te< 1eV Ionisation starts at Te> 2 eV These two requirements cannot be optimally fulfilled simultaneously
Electron excitation CO2 vs reduced E field ν3(001) asymmetric stretch mode @ E/n=2x10-16 Vcm2
Characteristic time scales and lengths • typical electric field strength on axis RF cavity E=27kV/m @ 915MHz (PRF=3kW) Half cycle time τ=0.546 ns • distance travelled by an electron in vacuum accelerated in this E-field during a half cycle s=½(eE/m)t2 ~ 720 μm • In contrast, CO2 ions move only 9 nm, remaining essentially stationary • The speed acquired by electrons in this half cycle v=at becomes v= 2.6 10 6 m/s, i.e. an energy of ~20eV • At this energy De Broglie wavelength λ=h/p is 0.28 nm, hence of the size of the CO2 diameter, i.e. ineffective in vibrational excitation • The electron neutral collision times follow from the cross section data Itikawa • At low pressure (1 mbar) λtot ~ 370 μm, i.e. λtot~s and electron gains energy • At high pressure (100 mbar) λtot ~ 4μm, i.e at 1/100 of RF cycle electron is knocked off-course, not able to gain speed • interaction time electron - CO2 molecule τexc = 2a0/ve = 0.39 fs for a 1eV electron, much faster than vibration time τvib = 14 fs, ie CO2 frozen during interaction • CO2 - CO2 collision time τint = 4a0/vth = 1.2 ps ie molecules locked during 100 oscillations • c
Electron - CO2 interaction times τexc << τvib <<τint <<τetot<< τev <<τnn~ τRF @ 100mbar CO2 molecule is vibration excited in the ground state 1Σ+ by high rate electron impact VV exchange process populates the higher 1B2 vibration energy levels of the CO2 molecule
Plasma parameters • In general plasma collision times much longer than neutral collision times. However, at extremely low electron temperature and high density prevailing in our experimental situation, these times become near neutral collision times. Hence, Coulomb collisions play some role in thermalisation. • τee < τei<< τii< τie
Debye length and number of particles Debye sphere • Debye length small compared with plasma dimension • Number of particles in Debye sphere is unusually small
Plasma frequency as function of density The RF frequency (915 MHz) is lower than the plasma frequency. Hence, the wave cannot propagate. With collisions included, the wave can propagate, but the RF field is essentially stationary for the processes considered.
V-T Relaxation efficiency is function ionisation degree ηVT is the fraction of vibration energy going into dissociation over the fraction going into translation energy. This ηVT turns out to be a function of ionisation degree. Here comes the plasma! At a pressure of 200mbar (no=5.38E18cm-3), a relaxation efficiency ηVT = 80% is reached at an electron density ne=1.7E13cm-3, i.e. quite high!
Vibration energy loss • At vibration levels up to 20, the dissociation energy, the vibration pumping exceeds the translation loss
Electron energy loss in CO2 plasma electrons electric field collisions vibrational excitation Electronenergy loss dependsonreducedelectric field dependson average electronenergy Rusanov et al. Usp. Fiz. Nauk. 134 185 (1981)
Vibration Excitation CO2 vs. Reduced E-Field Few electrons Low reduced electric field Electron-neutral collisions ν3(001) = CO2 asymmetric stretch mode vibrational excitation Rusanov et al. Usp. Fiz. Nauk. 134 185 (1981)
Nonequilibrium effects: Treanor distribution Telectron > Tvib > Tgas electrons electric field collisions vibrational excitation Treanor distribution: overpopulation of highervibrationalstatesleads to loweractivationenergies, fasterkinetics Rusanov et al. Usp. Fiz. Nauk. 134 185 (1981)