Download
1 / 44
440 likes | 461 Vues
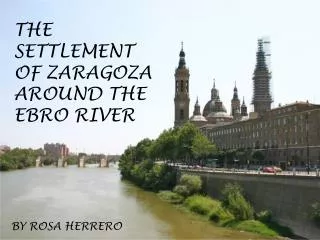
ECONOMIC ANALYSIS OF THE EBRO WATER TRANSFER. José Albiac Servicio de Investigación Agroalimentaria. Unidad de Economía Agraria. Diputación General de Aragón. Antonio Valero, Javier Uche and Luis Serra Centro de Investigación de Recursos y Consumos Energéticos (Fundación CIRCE)

E N D
ECONOMIC ANALYSIS OF THE EBRO WATER TRANSFER José Albiac Servicio de Investigación Agroalimentaria. Unidad de Economía Agraria. Diputación General de Aragón. Antonio Valero, Javier Uche and Luis Serra Centro de Investigación de Recursos y Consumos Energéticos (Fundación CIRCE) Universidad de Zaragoza (UZ)
CONTENTS A. EBRO TRANSFER AND SUSTAINABLE DEVELOPMENT. B. IRRIGATION WATER MANAGEMENT IN THE SPANISH LEVANTE. C. ECONOMIC ANALYSIS OF THE EBRO TRANSFER AND THEIR ALTERNATIVES. D. CONCLUSIONS.
A. EBRO TRANSFER AND SUSTAINABLE DEVELOPMENT. A.1. WATER IN JOHANNESBOURG SUMMIT. A.2. EU POLICY ON WATER. A.3. AGREEMENTS ON ECONOMIC POLICY: THE EBRO RIVER. A.4. Annex: The Spanish scientific community.
A.1. WATER IN JOHANNESBOURG KEY OUTCOMES – TYPE 1 AGREEMENTS The summit reafirmed sustainable development as a central element of the international agenda: • Economic development • Social development • Environmental protection
A.1. WATER IN JOHANNESBOURG KEY OUTCOMES – TYPE 1 AGREEMENTS Changing unsustainable patterns of consumption • A 10 years framework of programmes towards sustainable consumption and production within the carrying capacity of ecosystems... • Encourage relevant authorities to take sustainable development considerations into account in decission making
A.1. WATER IN JOHANNESBOURG KEY OUTCOMES – TYPE 1 AGREEMENTS Protecting and managing the natural resources • Halve to 2015 the proportion of people without access to safe drinking water and sanitation • Develop integrated water resources management and water efficiency plans by 2005: integrated river basin, watershed and groundwater management. • ... theefficient use of water resources in agriculture.
A.1. WATER IN JOHANNESBOURG THE EU AT THE JOHANNESBOURG SUMMIT The EU announced the “Water for Life” intiative that seeks to engage partners to meet goals for water and sanitation, firstly in Africa and Central Asia
A.2. EU POLICY ON WATER EU WATER FRAMEWORK DIRECTIVE • The new EU water policy ambitiously combines protection of ecological status with long term water use and sustainable development • It is a new instrument for spatial planning and integration of policies, a legal framework of common approach, principles, environmental and sustainability objectives
A.2. EU POLICY ON WATER EU WATER FRAMEWORK DIRECTIVE: Objectives • Protect high ecological status and good surface and ground water status • Respect protected nature and drinking water areas • Pricing of water use • One river basin district – One management plan • Extensive public consultation
A.3. AGREEMENTS... THE AGREEMENTS ON WATER POLICY ARE: • The integrated water management at basin level: One river basin district – One management plan • Pricing of water use and the Full Cost Recovery concept to control the water demand management.
A.3. AGREEMENTS... ACCORDING TO THOSE AGREEMENTS, SOME DEFECTS ARE DETECTED IN THE EBRO TRANSFER (NHP 2000): • The detailed economic analysis of the effects on water price for irrigation (80% consumption in Spain) in the Spanish Levante is not given. • The local analysis of the diverted cost and their alternatives is not rigorously analyzed in the NHP.
A.3. AGREEMENTS... THESE TWO ISSUES ARE SO IMPORTANT SO THAT WE CONSIDER THEY MUST BE CAREFULLY ANALYZED BEFORE TO PUT INTO EFFECT THE WATER TRANSFER PROPOSED IN THE NHP 2000.
B. IRRIGATION WATER MANAGEMENT IN THE SPANISH LEVANTE B.1. QUESTIONS EXAMINED B.2. RESULTS B.3. NHP INCONSISTENCY. B.4. TRANSFER SUBSIDIES. B.5. DESALINATION. B.6. SUMMARY.
B.1. QUESTIONS EXAMINED Study on agricultural water demand management and supply policy • The study considers water demand management as an alternative to the supply policy of the Ebro water transfer, proposed by the Spanish National Hydrologic Plan (NHP, 560 hm3 for irrigation in the Levante from the expected 820 hm3/y). • The National Hydrological Plan examines the effects of the water transfer on net revenue, agricultural production and employment, in the Levante irrigation area. But the procedure used in the NHP is excessively simple and poorly supported.
Scope: 35 counties, 423.000 ha of irrigated acreage 94% Valencia 80% Murcia 86% Almería Crops:Orange, mandarin, lemon, peach, apricot and almond trees, vineyards, olive trees, lettuce, tomato, artichoke, melon, pepper, onion, watermelon, bean, pumpkin, cucumber, broccoli, potato, wheat, barley, corn, rice, alfalfa, and sunflower. Tomato, pepper, melon, bean, and watermelon crops can be cultivated protected (green house) or not protected. Methodology: Linear programming Objective function: Net revenue 80 crop activities and 60 constraints 22 soil constraints 12 water constraints 12 labor constraints Study financed by the Spanish Ministry of Environment and the Aragón Govern- ment B.1. QUESTIONS EXAMINED
B.1. QUESTIONS EXAMINED Scenarios considered Two demand management and an offer management scenarios: • In the first scenario, aquifer overexploitation is prohibited. • In the second scenario, a price raise is considered in order to calculate the price of water that balances the global water demand. • The third scenario studies the net revenue at real costs of water transferred by the Ebro River or desalted seawater.
B.2. RESULTS First scenario: Elimination of Overexploitation Larger losses • Almería • Campo Dalias • Bajo Almanzora • Campo Níjar-BajoAndarax • Murcia • Valle del Guadalentín • Noreste
B.2. RESULTS First scenario: Elimination of Overexploitation • A fall of 20 percent in the final agricultural production and net revenue. Nearly 70 percent of the losses of net revenue, that’s 204 million € of 306 in losses, occur in Almería (South basin). • The counties with greatest losses in Almería are those which have very profitable crops, and in Segura those which bear the greatest reduction of available water: in Campo Dalias revenue and net revenue fall 378 and 180 million €, and in Valle del Guadalentín they fall 103 and 44 million €, respectively.
B.2. RESULTS Second scenario: Price increases • An increase of 0,12 €/m3reduces the size of the water project from 820 hm3to 379 hm3 with a cost to farmers of 294 million € net annual revenue, that could be offered by the administration or by other water users. • An increase of 0,18 €/m3eliminates water scarcity in Levante at a cost of 423 million € for farmers, remaining only a deficit of 68 hm3 in Segura and 49 hm3 in South. This amount could be paid by the administration or other water use groups, so that the society doesn’t carry out the investment of more than 4 billion €.
B.3. NHP INCONSISTENCY Severe problem of inconsistency of the National Hydrologic Plan in the Segura basin • The diverted water will have high costs in the range 0,19-0,75 €/m3 depending on the county, well above the low price that farmers pay now, and this elevated water price will only pay for itself in counties with high profit crops. • The volume of diverted water that Levante counties can absorb at this price is 863 hm3 in Júcar, 215 hm3 in Segura and 112 hm3 in South. These quantities should be compared with the allocations by NHP, which are 141 hm3 in Júcar, 362 hm3 in Segura and 58 hm3 in South: INCONSISTENCY.
B.3. NHP INCONSISTENCY Effective water demand, compared with the volume of over-exploitation and irrigation guarantee
B.4. TRANSFER SUBSIDIES • In Segura, if a surcharge is placed on the present urban and industrial water usage in the Murcia region (plus the transfer allotment), in order to subsidize in 0,38-0,59 €/m3 the allocation for agricultural and environmental use, the surcharge will reach 0,68 €/m3. The resulting price would be about 1,59 €/m3, similar to the price paid in the Canary Islands.
B.5. DESALINATION Cost of desalination is 0,52 €/m3, including distribution costs Desalination cost is lower in the following coastal counties: • Valle del Guadalentín • Bajo Almanzora • Campo Nijar-Bajo Andarax • Campo Dalias
B.6. SUMMARY Demand Management Measures Banning Aquifer Over-exploitation - losses in net revenue 305 million € but Almería 203 million € - ↓ water demand 454 hm3 Increase of Water Prices in 0,12 €/m3 - losses in net revenue 294 million € - ↓ water demand 441 hm3 Increase of Water Prices in 0,18 €/m3 - losses in net revenue 423 million € - ↓ water demand 703 hm3
B.6. SUMMARY Supply Management Measures Ebro Transfer - investment 6.000 million € (expected) - water costs 0,19 to 0,75 €/m3 Problem with Ebro transfer: not enough “effective water demand”in Segura. Subsidy to maintain present low prices 263 million €. Desalination - water cost 0,52 €/m3 - effective water demand 287 hm3 Desalination coupled with an increase of 0,12 €/m3 in agricultural water prices, balances water supply and demand in Levante
C. ECONOMIC ANALYSIS OF THE EBRO TRANSFER AND THEIR ALTERNATIVES C.1. OBJECTIVE C.2. HYPOTHESIS C.3. RESULTS. AVERAGE AND LOCAL ANALYSIS. C.4. EXTENDED ANALYSIS C.5. ANALYSIS OF ALTERNATIVES C.6. PROPOSALS C.7. CLOSURE
C.1. OBJECTIVE The main objective of the research is to calculate and analyze the average and local costs of the Ebro Transfer (ET), and to compare the results with other feasible alternatives and finally, propose a plan for each receiving basin avoiding the use of the ET.
C.2. HYPOTHESIS Calculation of the investment costs: • The methodology of the Draft Bill of the NHP (AE volume) to evaluate the cost of the infraestructure: “Valoración general de obras hidraúlicas para estudios de planificación y viabilidad, (CEDEX, 1998)” . • The available information included in the Report “Memoria-Resumen para la evaluación de impacto ambiental del proyecto de transferencias autorizadas por la Ley del Plan Hidrológico Nacional, (Trasagua, 2002)”
C.2. HYPOTHESIS The main differences with respect the economic analysis of the Draft Bill of the NHP 2000, are: • The amortization period of channels and electromechanic components is taken to 25 years (4% interest rate). • New dams included in the document proposed by Trasagua (Marquesado, Azorín) are analyzed. • The compensation to hydroelectric companies and new lines to supply the pumping stations is estimated. • The minimum cost of the Ebro Delta Integral Plan (PIDE) included in the NHP is accounted.
C.3. RESULTS • The resulting investment cost of the new route is only the 90,3% calculated in the NHP (AE volume, table 21, p. 107): 3.400 million €. • The energy cost is on average 1,781 kWh/m3 (2,127 only elevations) and 0,08 €/m3. • The resulting average cost of the new path increases with respect to the proposed in the NHP 2000 (0,5 €/m3 vs. 0,31 €/m3):0,537 €/m3 and 0,337 €/m3respectively for the South and North path.
C.3. RESULTS Which is the effect of the amortization period in the project (4%)?
C.3. RESULTS And the effect of the interest rate (at 25 years)?
C.3. RESULTS The local economic analysis of the WTT will try to answer the problem that arises in the question Nº 13 of the UE with respect the Spanish EAE of the NHP 2000: “...it is assumed that the price of diverted water will be the same independently of the receiving zone...[]...is this the right way to analyze the economic analysis?”
C.3. RESULTS The local economic analysis of the WTT shows strong differences in resulting costs Average cost
C.3. RESULTS The local energy consumption is closely related to the altitude of the new path:
C.4. EXTENDED ANALYSIS But the real cost of transferred water in the future could be higher, because: • The effect of partial surpluses in the Ebro Basin (< 1.050 hm3/year, see fig. 93 of the ASH) is not taken into account:
C.4. EXTENDEDANALYSIS The cost increase due to of partial surpluses of the Ebro Basin is another doubt for the UE: “...for example, if half of that number (1.050 hm3) could be diverted, apparently the price per cubic metre in the receiving region would be 0,6 €. The Commission would confirm...”(question Nº 12).
C.4. EXTENDEDANALYSIS The effect on partial surpluses of the Ebro Basin has been evaluated
C.5. ALTERNATIVES If we compare desalted and diverted water: The average cost of desalted water is 0,48 €/m3. Tousdestination (63 hm3) is the point of rupture of the economic analysis of the Ebro Transfer
C.7. CLOSURE The economic analysis of the water transfer proposed by Trasagua (WTT) shows that: • Water demand management techniques can be applied where the cost of diverted water is lower than the other large-scale alternative: desalination (Barcelona, Júcar). • The combined use of desalination, water reuse and water demand management for irrigation is cheaper than the diverted water (Segura, Vinalopó and Almería).
D. CONCLUSIONS D.1. MOTIVATION D.2. IRRIGATION WATER MANAGEMENT IN THE LEVANTE D.3. ECONOMIC ANALYSIS OF EBRO TRANSFER. D.4. QUI PRODES? Long Term Middle Term Short Term
D.4. QUI PRODES? Long Term Should be agriculture/tourism be the same in the next 50 years? • Neighbouring countries (immigration, commercial agreements,...) • Climate change.
D.4. QUI PRODES? Middle Term The urban demand patterns show that water consumption is decreasing In general, water is not profitable for farmers. Maybe, irrigation lands with water rights should be substituted by tourist leisure centers (golf courses, in general including high-consuming activities). • Is this sustainable tourism? • Which are the real beneficiaries?
D.4. QUI PRODES? Short Term The investment on water reuse, demand management and desalination are low and decreasing cost techniques. Hydraulic works are a mature technology with high investment costs. Finished works have in general a higher budget than the expected. • Which are the most favoured groups?