Building and Testing Rain Gardens
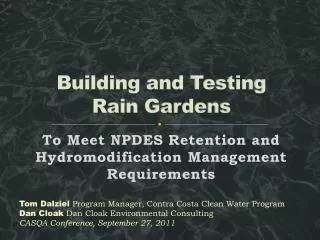
Building and Testing Rain Gardens. To Meet NPDES Retention and Hydromodification Management Requirements. Tom Dalziel Program Manager, Contra Costa Clean Water Program Dan Cloak Dan Cloak Environmental Consulting CASQA Conference, September 27, 2011. 21 Copermittees

Building and Testing Rain Gardens
E N D
Presentation Transcript
Building and Testing Rain Gardens To Meet NPDES Retention and Hydromodification Management Requirements Tom Dalziel Program Manager, Contra Costa Clean Water Program Dan Cloak Dan Cloak Environmental ConsultingCASQA Conference, September 27, 2011
21 Copermittees • One million residents • Oldest city incorporated 1876; newest incorporated in 1999 • Annual rainfall from 12" to 30" • Mostly clay soils
LID in Contra Costa • Stormwater C.3 Guidebook published 2005 • LID approach to treatment • Well received and widely implemented • Continuously improved under direction of municipal staff • Fifth Edition published 10/20/2010 • Hydrograph Modification Management Plan (HMP) approved 2006 • Uses LID to control flow peaks and durations • Based on computer-modeled performance of bioretention and other LID facilities • HMP requires monitoring 5 locations to validate model
Topics • Bioretention: • What we don’t know • Why we need to know it • Model of Bioretention Performance • Rate and duration of underdrain discharge • Design of Our Experiment to Validate Model • Design and Construction of Bioretention Facilities and Monitoring Instrumentation • Office Building • Residential Townhouse Development
Bioretention evapotranspiration biotreatment infiltration What proportion of runoff goes where?
Modeling Bioretention evapotranspiration inflow One Acre underdrain infiltration
About the Model • A watershed model (HSPF) was adapted to characterize bioretention performance. • Stage-storage discharge relationships for each layer represented within FTABLEs in HSPF. • At each time step, moisture content of the bioretention soil media, matric head within soil pores, and hydraulic conductivity of the soil media are recalculated. • Watershed models are typically calibrated using stream gage data. This model is uncalibrated.
Limitations of the model • Pan evaporation was used to calculate evapotranspiration. • Single, textbook values were used for hydraulic conductivity of underlying soils. • Lateral movement of moisture from the bioretention media and gravel layer into the surrounding soil was not accounted for. • The effects of head above the underlying soil surface were not accounted for.
250,000 hours: Sort by flow This flow was exceeded during 2 hours/250,000 hours (0.0008%) This flow was exceeded during 7 hours/250,000 hours (0.0028%)
Now, for a real installation: Collect on-site rain gage data. • Calculate • hourly inflow for the real tributary area Measure actual underdrain flow. Use the model to predict hourly ET, infiltration, and underdrain flow
Model Validation/Tweaking • Compare predicted to actual outflow rates (hour by hour). • Tweak the model inputs so that model output more accurately represents actual underdrain discharge (hour-by-hour and storm-by-storm). • Then, use those new model inputs to recalculate sizing factors for bioretention minimum area (A), surface storage volume (V1) and subsurface storage volume (V2).
Bonus We can then input 30+ years of rainfall data and use our validated/tweaked model to predict the percent infiltrated + evapotranspirated (annual average).
Insight Within some of the facilities, we will also track saturation level.
Outlet Design Overflow elevation
Bioretention FacilityCross-section Not to Scale Overflow structure24" min x 36" min. concrete drop inletor manhole with frame and atrium or beehive grate, ¼ “ openings Curb cut (or curbinlet if neededto ensure runoff capture) 4" min. dia. SDR 35 or equiv. sweep bend and cleanoutmin. 2" above overflow level Walls as needed to establish constant rim elevation around perimeter of facility Adjacent pavement Cobbles or splash block Min. 6" or asneeded to achieve V1 Top of Soil Layer TSL Install all plantings to maintainTSL at or below specifiedelevation 3" max. mulch if specified in landscape plans Male threaded pipe end with cap center-drilled to specified orifice dia. (Omit cap for treatment-only facilities.) Schedule 80 (no perforations)seal penetration with grout Specified soil mix Min. 18“ Top of Gravel Layer TGL 4 " min. dia. SDR 35 or equiv., perforations facing down Min. 12“ or as needed toachieve V2 24" 6" Class 2 perm(Assume 40% porosity for calculation of V2) To storm drain or approved discharge point Bottom of Gravel Layer BGL Large diameter closed perforated pipesor arches may augment storage to achieve V2 Moisture barrier ifneeded to protectpavement or structures Native soil, no compaction. Rip to loosen. • Notes: • No liner, no filter fabric, no landscape cloth. • Maintain BGL. TGL, TSL throughout facility area at elevations to be specified in plan. • Class 2 perm layer may extend below and underneath drop inlet. • Preferred elevation of perforated pipe underdrain is near top of gravel layer. • See Appendix B for soil mix specification, planting and irrigation guidance. • See Chapter 4 for factors and equations used to calculate V1, V2 ,and orifice diameter.
Instrumentation • Required 12” clear from orifice to bottom of catch basin • Installed weir and pump system to prevent storm drain backups from flooding instrumentation Hydro Services TV!LT Tipping Bucket
Status and Schedule • Development projects completed summer 2011. • Instrumentation installed September 2011. • Data collection during 2011-2012 and 2012-2013 rainy seasons. • Analysis of initial data during 2012. • Report due to SF Bay Water Board April 1, 2014
Credits and Info • Jolan Longway, City of Pittsburg • Carlton Thompson, City of Walnut Creek • Scott McQuarrie and Mark Boucher, Contra Costa Flood Control District • www.cccleanwater.org or search for “Contra Costa Stormwater”