Download
1 / 33
350 likes | 543 Vues
Baryons’10, Dec. 9, 2010, Osaka U. Third Moments of Conserved Charges in Phase Diagram of QCD. Masakiyo Kitazawa (Osaka Univ.) M. Asakawa, S. Ejiri and MK, PRL 103 , 262301 (2009). ?. Phase Diagram of QCD. RHIC, LHC. Quark-Gluon Plasma. T. lattice. Hadrons. Color SC. m. 0.

E N D
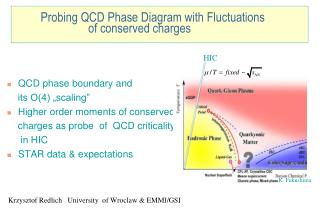
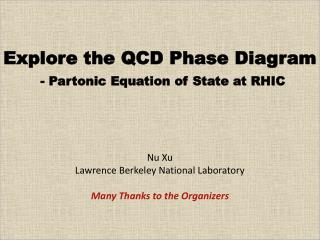
Baryons’10, Dec. 9, 2010, Osaka U. Third Moments of Conserved Chargesin Phase Diagram of QCD Masakiyo Kitazawa (Osaka Univ.) M. Asakawa, S. Ejiri and MK, PRL103, 262301 (2009).
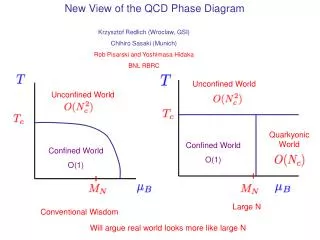
? Phase Diagram of QCD RHIC, LHC Quark-Gluon Plasma T lattice Hadrons Color SC m 0
QCD Critical Point And, how many? Where is the QCD critical point? MK, et al.,2002 Stephanov, ’07
Yamamoto, et al. ’06 MK, et al.,2002 Zhang, et al., ’09 Basler, Buballa, ’10 GL analysis induced by axial anomaly QCD Critical Point And, how many? Where is the QCD critical point? Stephanov, ’07
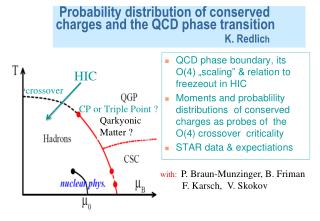
? Phase Diagram of QCD RHIC, LHC Quark-Gluon Plasma T • non-uniform states? • quarkyonic state? • BEC/pseudogap region? lattice Hadrons Color SC m 0
QCD Thermodynamics on the Lattice Phase diagram for m=0 Equation of States physical? Hot QCD, 2009
Ultra-Relativistic Heavy Ion Collisions from PHENIX collaboration Observables: • collective flow • photon / dilepton production rates • jet / particle correlations • event-by-event fluctuations and higher order moments • and etc… NOTE: Experimental data @ LHC is available! ALICE, 1011.3913/3914
Dilepton Production Rate g e+ e- PHENIX, 2009 • Most direct probes of the QGP. • They are produced in all stages of time evolution.
RHIC energy scan Phase Diagram of QCD RHIC, LHC T lattice ? Hadrons Color SC m 0
However, • Region with large fluctuations may be narrow. • Fluctuations may not be formed well due to critical slowing down. • Fluctuations will be blurred by final state interaction. Fluctuations at QCD Critical Point Stephanov, Rajagopal, Shuryak ’98,’99 2nd order phase transition at the CP. baryon # susceptibility divergences of fluctuations of • pT distribution • freezeout T • baryon number, • proton, chage, …
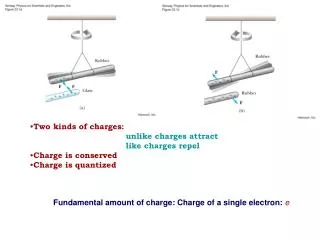
(Net-)Charge Fluctuations Asakawa, Heinz, Muller, ’00 Jeon, Koch, ’00 D-measure: NQ NQ: net charge # / Nch: total # Dy hadrons: quark-gluon: values of D: D ~ 3-4 largesmall D ~ 1 When is experimentally measured D formed? • Conserved charges can remember fluctuations • at early stage, if diffusions are sufficiently slow.
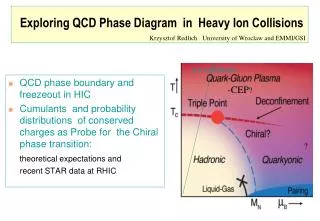
Experimental Results for D-measure RHIC results: D ~ 3 PHENIX ’02, STAR ’03 • hadron gas: D ~ 3-4 • free quark-gluon gas: D ~ 1 STAR, ’10
Experimental Results for D-measure RHIC results: D ~ 3 PHENIX ’02, STAR ’03 • hadron gas: D ~ 3-4 • free quark-gluon gas: D ~ 1 STAR, ’10 • Failure of QGP formation? • Is the diffusion so fast? NO!The result does not contradict these statements. Large uncertainty in Nch. Bialas(’02), Nonaka, et al.(’05)
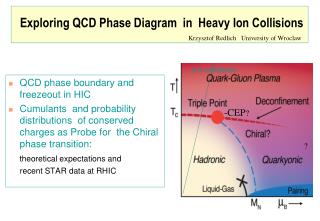
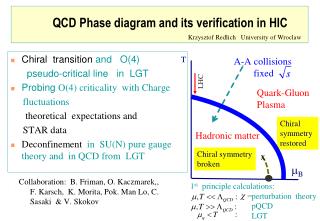
Dy Take a Derivative of cB cB has an edge along the phase boundary changes the sign at QCD phase boundary! : third moment of fluctuations (skewness) • m3(BBB) can be measured by event-by-event • analysis if NB in Dy is determined for each event. NB
No dependence on any specific models. • Just the sign! No normalization (such as by Nch). Impact of Negative Third Moments Once negative m3(BBB) is established, it is evidences that (1) cB has a peak structure in the QCD phase diagram. (2) Hot matter beyond the peak is created in the collisions.
mQ : chemical potential associated to NQ Third Moment of Electric Charge Experimentally, • net baryon # in Dy : difficult to measure • net charge # in Dy : measurable!
mQ : chemical potential associated to NQ Third Moment of Electric Charge Experimentally, • net baryon # in Dy : difficult to measure • net charge # in Dy : measurable! cB cI/9 Under isospin symmetry, isospin susceptibility (nonsingular) singular @CEP Hatta, Stephanov ’02
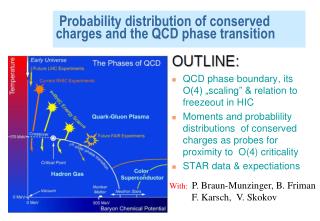
The “Ridge” of Susceptibility Region with m3(BBB)<0 is limited near the critical point: = 0 at mB=0 (C-symmetry) m3(BBB) is positive for small mB (from Lattice QCD) ~ mB at mB>>LQCD (since W~mB4 for free Fermi gas) T m
m3(BBB)<0 m3(QQQ)<0 The “Ridge” of Susceptibility Region with m3(BBB)<0 is limited near the critical point: = 0 at mB=0 (C-symmetry) m3(BBB) is positive for small mB (from Lattice QCD) ~ mB at mB>>LQCD (since W~mB4 for free Fermi gas) Analysis in NJL model: T m
E : total energy in a subvolume measurable experimentally Signs of m3(BBE) and m3(QQE) change at the critical point, too. Derivative along T Direction T m
“specific heat” at constant • diverges at critical point • edge along phase boundary More Third Moments T m
“specific heat” at constant • diverges at critical point • edge along phase boundary More Third Moments T m Signs of these three moments change, too!
2-flavor NJL; G=5.5GeV-2, mq=5.5MeV, L=631MeV Model Analysis • Regions with m3(*EE)<0 exist even on T-axis. • This behavior can be checked • on the lattice • at RHIC and LHC energies
Trails to the Edge of Mountains m3(EEE) on the T-axis • Experimentally: RHIC and LHC • On the lattice:
c4 c6 Cheng, et al. ‘08 Trails to the Edge of Mountains m3(EEE) on the T-axis • Experimentally: RHIC and LHC • On the lattice: m3(QQQ), etc. at mB>0 • Experimentally: energy scan at RHIC • On the lattice: ex.) Taylor expansion
Summary Seven third moments m3(BBB), m3(BBE), m3(BEE), m3(EEE), m3(QQQ), m3(QQE), and m3(QEE) all change signs at QCD phase boundary near the critical point. To create a contour map of the third moments on the QCD phase diagram should be an interesting theoretical subject. Negative moments would be measured and confirmed both in heavy-ion collisions and on the lattice. In particular, (1)m3(EEE) at RHIC and LHC energies, (2)m3 (QQQ)=0 at energy scan, are interesting!
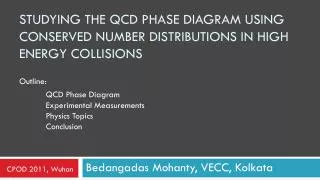
Proton # Skewness @STAR STAR, 1004.4959 Measurement of the skewness of proton number @STAR shows that for 19.6-200GeV.
Proton # Skewness @STAR STAR, 1004.4959 Measurement of the skewness of proton number @STAR shows that for 19.6-200GeV. Remark: Proton number, NP, is not a conserved charge. No geometrical connection b/w 2nd & 3rd moments.
Higher Order Moments Ratios between higher order moments (cumulants) RBC-Bielefeld ’09 Ejiri, Karsch, Redlich, ’05 Gupta, ’09 4th/2nd at m=0 reflects the charge of quasi-particles Quarks:1/32 Hadrons:1 Higher order moments increase much faster near the CP. Stephanov, ’09 Rajagopal, et al., ’10
Derivative along T direction simple T-derivative: E : total energy in a subvolume measurable experimentally mixed 3rd moments: Problem: T and m can not be determined experimentally.
z x Elliptic Flow 1 Elliptic flow v2 beam axis reaction plane Y v2<0 v2>0 reaction plane
Quark # Scaling of v2 • Divide by quark number. • Clear quark number scaling! How to interpret? Nonaka, et al., ’03
Elliptic Flow @ ALICE ALICE, 1011.3914 Heavy ion collisions have been performed at LHC! new data