Download
1 / 36
360 likes | 489 Vues
This study investigates how cervical cytology screeners make categorical decisions under uncertainty, focusing on Borderline Nuclear Changes (BNC). By examining 50 cell groups previously identified as having borderline results, the research employs Latent Trait Analysis to reveal inconsistencies in screener judgments. The project compares intuitive judgments with statistical modeling approaches, seeking to enhance the reproducibility of diagnoses and improve screening reliability. Challenges related to ambiguous material in pathology and the implications for diagnostic credibility are explored.

E N D
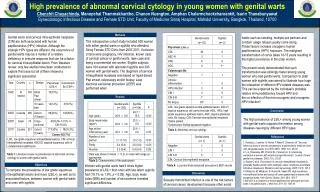
cue+ cue- Observer Variation under the Microscope: comparing intuitive with statistical prediction in cervical cytology cue+ Open University MSc Project Module 2006 Marilyn Catlow cue-
Professional scrutiny of ambiguous material This study is an attempt to capture screener judgment activities - as individuals and as an occupational group - when they are faced with having to make categorical decisions under conditions of uncertainty. 50 cells (groups) with a referralborderline nuclear changes in squamous cells result were examined by 19 certificated cytology screeners. The cells selected originally featured a consensus borderline interpretation between primary screener, checker and reporting pathologist. Latent trait analysis is used for the analysis of categorical data. It includes a theory that relates the unobserved ‘latent’ construct of interest (the hidden actual state) to the observed (manifest) variables that are actually measured. In this study, Latent Trait Analysis demonstrates inconsistencies at the interface between ‘professional scrutiny’ and ‘ambiguous material’ where the observable differences are very small.
Smears examined by pathology laboratories, by result of adequate test, 2004-05 Breakdown of positive proportion Laboratories examined an estimated 4 million samples
BNC – a problem area • In terms of abnormality grading Borderline Nuclear Changes (BNC) is a problem area for cervical screening from three perspectives. • BNC does not exist as a category in the histological gold standard parallel. • Of the abnormal categories available, borderline nuclear changes is reported more often than all other abnormal categories combined. • The equivocal changes that produce a borderline result make it the least reproducible abnormal diagnosis amongst cytologists • This impacts on the credibility of the test, and on the economics of its provision.
Reproducibility of opinion is crucial in a visual inspection taskThree Questions • Do screeners differ in the weights that they attach to deviations on specific nuclear characteristics? • Is it possible to build and demonstrate a consensus construction of a ‘true’ borderline? • Could a more structured method of examining equivocal changes reduce the number of borderline results without compromising the reliability of the screening process?
A framework underlying the judgment process isThe Brunswick lens diagram JUDGED STATE CUE 1 Nuclear Enlargement CUE 2 Density CUE 3 Nuclear Membrane Irregularity CUE 4 Chromatin Distribution CUE 5 Nuclear- Cytoplasmic Ratio CUE 6 Aniso- nucleosis ACTUAL STATE
Brunswick Lens – judgment process An assumption is that there is an actual hidden (or latent) condition which a judge is trying to identify and classify from signals of differing character, frequency and strength in the form of cues. The judge tries to infer the condition from the observable cues it produces. The observable nuclear cues most often implicated in squamous cell dyskaryosis include nuclear enlargement; hyperchromasia; nuclear membrane irregularity; nuclear texture; raised nuclear cytoplasmic ratio; and variation within a group. The particular pattern of characteristics which the viewer sees is what he or she has to work back from to arrive at the underlying condition. The judge succeeds to the extent that he or she brings the characteristics back together again in the same way that the actual state produced them. D300:OU
Cue+ Cue- ‘Just noticeable difference’ pos ? Cue+ ‘Just noticeable difference’ neg Cue- ?
A threshold of ‘just noticeable difference’ • With training, screeners learn how to differentiate cells that are normal from those that are potentially cancerous from classic morphological changes to the cell nucleus. • However, these are frequently not as clear as text books and image atlases would have us believe as nuclei often vary in the clarity of their characteristics. • The same set of cues can be perceived by different screeners as negative, benign inflammatory processes, and dyskaryosis. The cumulative recognition is never stronger than amber. • In this study I draw on signal detection theory, and the concept of a threshold of ‘just noticeable difference’ to harness observer variation on 50 squamous cells with a prior consensus borderline result. 3 sets of 2x2 tables were used to harvest judgments.
50 cells with a consensus BNC result: 19 certificated screeners Three assessment modalities • Conventional intuitive judgment: Negative, BNC or Dyskaryosis. Results on this component show that there was not a full consensus judgment on any sample. Collection of empirical data using 2x2 tables: • Coding Frame: Recorded thresholds for abnormality on six nuclear criteria • Decision Aid: The coding frame is adapted to become an algorithmic decision aid
The Coding Frame The graphic is a series of 2x2 tables. It shows how the two related models I devised for the second and third assessments decompose the problem of borderline nuclear changes into manageable components. Screeners were asked to tick one box in each of three 2x2 tables. The following 3 slides show how empirical data on subjective judgments were collected. >2D int NMI+ NMI- NCR+ NCR- <2D int >Dense Texture+ Aniso+ <Dense Texture- Aniso- Enlargement, Density, Membrane Irregularity, Texture, N:C ratio,and Variation
This image, described as ASCUS?LG CIN was borrowed from the online Bethesda image atlas following the 2001 consensus conference.
>2xD intermediate nucleus <2xD intermediate nucleus a b >density of local neutrophil d c <density of local neutrophil
Irregular nuclear membrane Regular nuclear membrane a b Coarse / uneven chromatin d c Smooth / even chromatin
NCR >1/2 NCR<1/2 a b Aniso-nucleosis+ d c Aniso-nucleosis -
Coding Frame responses In the first table the observation was both abnormally large and hyperchromatic. In the second table neither the nuclear membrane nor the nuclear texture was perceived as abnormal. In the third NCR was within normal limits but there was variation between the nuclei in the group. 1 2 3 >2D int NMI+ NMI- NCR+ NCR- <2D int >Dense Texture+ Aniso+ √ √ <Dense Texture- √ Aniso-
Coding the Observations This is part of one screener’s coding frame assessment. The six columns on the right represent observations on nuclear characteristics. ‘1’ indicates an observer response for abnormal for a particular nuclear characteristic and ‘2’ indicates a normal response By adopting a quantitative approach to qualitative impressions, relating to the interpreted presence or absence of abnormality on specific nuclear cues, I was able to measure the still subjective judgments for each of nineteen participant screeners individually, and group judgments for each of 50 cells.
Competent Screener interpretation profile for a mix of frank positive and frank negative samples
Latent Trait Analysis (LTA): Observer Variation on test set of 50 BNC slides Screener A Screener B Do screeners differ in the weights that they attach to deviations on specific nuclear characteristics? The charts show how cell nuclei can vary in the clarity of their characteristics. Under these circumstances observer interpretations are not consensual at the nuclear component level. Altogether, there were nineteen screener participants and all observation profiles were very different.
LTA: Occupational group observation maps on a negative and positive case from the test set
A ‘true’ borderline? This is a group of immature squamous metaplastic cells. • This is how I see it now. • Two of the nuclei in the group are arguably twice the size of the reference intermediate nucleus; there is no hyperchromasia; • There is margination of chromatin at the nuclear membrane in some of the cells and occasional nuclear membrane irregularity; chromatin texture and distribution are within normal limits; • There is one cell where I would be worried about the nuclear cytoplasmic ratio; there is variation in size and shape within the group but I doubt whether it transgresses the threshold for abnormality.
A ‘true’ borderline?This case (a sample from this study with a negative outcome) was referred at colposcopy for cytology surveillance.
Is it possible to build and demonstrate a consensus construction of a ‘true’ borderline? Latent trait analysis can also show how cell nuclei vary in the ‘clarity’ of their characteristics making them difficult to judge. Coding Frame data: occupational group observation profile on the cell group shown. This promises interesting outcomes in a court of law, where expert witnesses are in dispute about what the slide shows.
Deductive reasoning Top down Quick Inductive reasoning Bottom up Slow Deductive vs. Inductive reasoning Could a more structured method of examining equivocal changes reduce the number of borderline results without compromising the reliability of the screening process? http://www.socialresearchmethods.net/kb/dedind.htm – William Trochim
Cognitive Continuum Theory CCT asserts that it is the task that tends to induce a particular mode of inquiry and also that people’s reasoning is more effective when the mode of thinking they adopt corresponds with the task structure. (Hamm, 1988).
A Decision Aid for Borderline examples FP TP FN TN The first model, a coding frame, is essentially a description of the cell as the observer sees it. The second model, an algorithmic decision aid, is a strategy. A hit in the TP or TN box is confirmation of diagnosis. A response in the FP or FN box directs you to the next 2x2 table for further assessment.
≥ 2D int ≤ 2D int TP FP >density of local neutrophil TN FN <density of local neutrophil
A Decision Aid for Borderline Nuclear Changes in cervical squamous cells This image, described as ASCUS?LG CIN was borrowed from the online Bethesda image atlas following the 2001 consensus conference. >2D-int NMI+ NMI- NCR+ NCR- <2D-int TP TP FP TP FP FP D+ Texture+ Aniso+ <Dense FN TN Texture- FN TN FN TN Aniso-
Comparing intuitive (pre-test) with decision aided (post-test) judgment modes My participants did not know that the cells they were considering were referral borderline examples until just before the third assessment – the one illustrated by the green bars labelled post-test. This was to create a judgment tension between the degree of belief in what the screeners were seeing and the degree of belief in what they ought to do about what they were looking at.
Intuitive Judgment Aided JudgmentBorderline rate 27% Borderline rate 12%
‘Accept error to make less error’* Experts tend to shun algorithmic decision aids because only the most salient variables inform the rule. The aim is to be ‘correct’ 70% of the time, and experts feel that they can do better than that. Where decisions have to be made under conditions of uncertainty the actuarial argument is to ‘accept error to make less error’, and a 70% hit rate would be better than the current 50:50 proposition using intuitive judgment. I make no claim that this is a great leap forward in the management of borderline changes in cervical cytology. But I do think that the strategy is worth trying out in the field, to make our reasoning processes visible to one another, and to gather data that might validate the model, or a modification of it, in improved practice. *Einhorn, H (1986) ‘Accepting Error to make less Error’
Accept Error to make Less Error Cue+ Cue- ? pos Cue+ ? neg Cue-
Thankyou I’d like to take this opportunity to thank David Smith for his encouragement and for organising availability of staff for participation. He also helped immensely with the all important constructive criticism in the presentation of my data. I also thank my erstwhile colleagues here at Northwick Park Hospital for their generous participation in testing the two models, fearing all the time that their judgment was being put under scrutiny.