Download
1 / 37
370 likes | 470 Vues
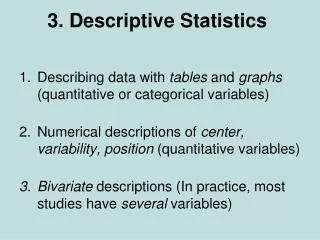
PSC200 3. Descriptive Statistics. Level of Measurement. Nominal Ordinal Interval. Lecture Overview Descriptive Statistics. Frequency Distribution Data= Information –but too much information. How do we summarize data? Central Measure of Tendency Mode Nominal, Ordinal, Interval

E N D
Level of Measurement • Nominal • Ordinal • Interval
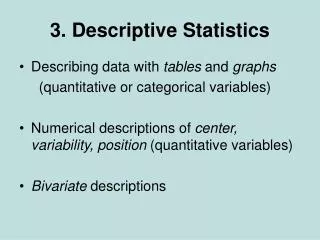
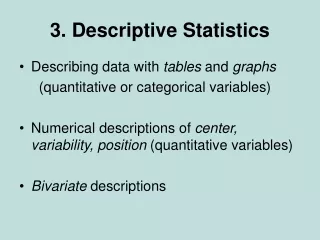
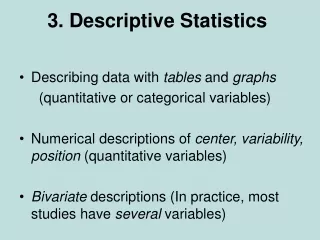
Lecture OverviewDescriptive Statistics • Frequency Distribution • Data= Information –but too much information. How do we summarize data? • Central Measure of Tendency • Mode Nominal, Ordinal, Interval • Median Ordinal, Interval • Mean Interval • Measures of Dispersion • Variance Interval
Understanding Distributions • What is “typical”?? Mode? Median? Mean? • Example: 2, 2, 2, 4, 6, 8, 8 • Mode: 2 • Median: 4 • Mean: 4.57 • Where does each measure of central tendency apply?
Nominal DataMeasure of Central Tendency: Mode • What is typical?
Nominal Data • SPSS: =>Analyze =>Descriptive Stats =>Frequencies… • What measures of central tendency & disperson can you identify? • What’s the difference between percent and valid percent?
Nominal DataDisplay matters! • Charts • Bar Charts • Percentage
Nominal Data Your Presidential Preference “If the presidential election were today, for whom would you vote?”
Nominal Data Why UR? “What was your primary reason for coming to UR?”
Ordinal Data • Sequence matters, e.g. rankings • Median now has meaning • Example: A12. Approve/disapprove Clinton job Do you approve or disapprove of the way Bill Clinton is handling his job as president? 1. APPROVE 5. DISAPPROVE 8. DON'T KNOW --> SKIP TO B1 9. RF 0. NA 1 5 8 9 Count 1177 565 55 10
A12a. Strength of approval/disapproval of Clinton IF R APPROVES CLINTON HANDLING JOB AS PRESIDENT/ IF R DISAPPROVES CLINTON HANDLING JOB AS PRESIDENT: Strongly or not strongly? 1. STRONGLY 5. NOT STRONGLY 8. DK 9. RF 0. NA; INAP, 8,9,0 in A12 0 1 5 8 9 Count 65 1145 587 8 2
Summary: Approval/Disapproval of Clinton Job as President Do you approve or disapprove of the way Bill Clinton is handling his job as president? Strongly or not strongly? SUMMARY: APPROVAL/ DISAPPROVAL OF CLINTON JOB AS Built from A12 and A12a. 1. Approve strongly 2. Approve not strongly 4. Disapprove not strongly 5. Disapprove strongly 8. DK (in A12 or A12a) 9. RF (in A12 or A12b) 0. NA
Nominal Data Party Identification “Generally speaking, do you usually consider yourself as a Republican, a Democrat, an Independent, or what?”
Interval Data • Continuous: numbers on the real line • Mean (arithmetic): • Example: 2, 3, 3, 5, 5, 6, 7, 7, 10, 201, 987 • Mean =(2+3+3+5+5+6+7+7+10+201+987)/11 = 112.36 • Median? • Modes?
Dichotomous or Dummy Variables • Nominal Data: Two Values • Can be treated as interval data
Skewed Distributions • Skewness: • For data Y1, Y2,…YN Skewness = Where is the mean, s is the standard deviation, and N is the number of data points
Median = 45 • Mean = 47.2 • Modes = 37, 42
Interval Data Grouped Into Categories for Visual Presentation
Variance • How dispersed or spread out the data is • Variance is the average squared deviation from the mean • Standard Deviation = square root of variance = s
Grofman, Koetzle, McGann. LSQ 2002. Congressional Leadership, 1965-96 • Are congressional leaders more extreme than their followers? • Discern between theories that claim that • leaders are more extreme • leaders are more centrist
House Party Members and Leaders Conclusion: leaders not necessarily centrist but drawn from party mode.
Gary Jacobson. 1987. The Marginals Never Vanished. AJPS. • “Marginal” – competitive elections • Do incumbents have a growing advantage in elections? • Do they win elections more easily than in the past? • Has electoral competition declined? Incumbent behavior changed? • Implications for democracy…
Incumbent Vote Share in House, 1952-82 Incumbents seem to be winning more votes in later years…
… but are incumbents winning more often? All House Incumbents
Are incumbents winning more often? Freshman Incumbents
Do Incumbents Win More Often? Senior Incumbents
Jacobson’s Conclusion • No net change in overall security for incumbents (same proportion, ca. 6-7%, lose) • Marginals do increase but so does vote swing. • First-term incumbents safer, senior incumbents not • Explains absence of change in incumbent behavior