Download
1 / 16
180 likes | 228 Vues
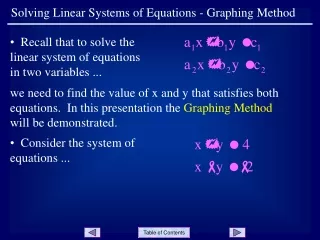
Learn about intersecting lines, coinciding graphs, parallel lines, and how to solve systems of equations by graphing. Practice drawing graphs and identifying solutions.

E N D
Graphing Systems of Equations
Intersecting Lines y = x + 5 y = -x -1 2 = -(-3) – 1 2 = 3 – 1 2 = 2 2 = -3 + 5 2 = 2 This screen shows two lines which have exactly one point in common. The common point when substituted into the equation of each line makes that equation true. The common point is (-3,2). Try it and see.
Intersecting Lines y = x + 5 y = -x -1 2 = -(-3) – 1 2 = 3 – 1 2 = 2 2 = -3 + 5 2 = 2 This system of equations is called consistentbecause it has at least one ordered pair that satisfies both equations. A system of equations that has exactly one solution is called independent.
Coinciding Graphs This graph crosses the y-axis at 2 and has a slope of –2 (down two and right one). Thus the equation of this line is y = -2x + 2. What do you notice about the graph on the right? It appears to be the same as the graph on the left and would also have the equation y = -2x + 2.
Coinciding Graphs Equation Y1 is for the graph on the left. Equation Y2 is for the graph on the right. Again, even though the equations appear to be different, they are identical.
Coinciding Graphs A system of equations which has lines with identical slopes and y-intercepts will appear as a single line as shown below. This system of equations is again consistent meaning that there is at least one ordered pair that satisfies both equations. This system of equations is dependent because it has an infinite number of solutions. Every point that is a solution for one equation is also a solution for the other equation.
Parallel Lines Line 1 crosses the y-axis at 3 and has a slope of 3. Therefore, the equation of line 1 is y = 3x + 3. Line 2 crosses the y-axis at 6 and has a slope of 3. Therefore, the equation of line 2 is y = 3x + 6. Parallel lines have the same slope, in this case 3. However, parallel lines have different y-intercepts. In our example, one y-intercept is at 3 and the other y-intercept is at 6. Parallel lines never intersect. Therefore parallel lines have no points incommon and are called inconsistent.
Solving by Graphing • Write the equations of the lines in slope-intercept form. • Use the slope and y-intercept of each line to plot two points for each line on the same graph. • Draw in each line on the graph. • Determine the point of intersection and write this point as an ordered pair.
Example Graph the system of equations. Determine whether the system has one solution, no solution, or infinitely many solutions. If the system has one solution, determine the solution. x – y = 2 3y + 2x = 9 Step 1: Write each equation in slope-intercept form. 3y + 2x = 9 - 2x -2x x – y = 2 + y +y 3y = -2x + 9 x = 2 + y - 2 -2 3 3 3 x – 2 = y
Example y x x – 2 = y Step 2: Use the slope and y-intercept of each line to plot two points for each line on the same graph. Place a point at –2 on the y-axis. Since the slope is 1, move up 1 and right 1 and place another point.
Example y x x – 2 = y Step 2: Use the slope and y-intercept of each line to plot two points for each line on the same graph. Place a point at 3 on the y-axis for the second line. The second line has a slope of negative 2/3. From the y-intercept, move down two and right 3 and place another point.
Example y x Step 3: Draw in each line on the graph. Step 4: Determine the point of intersection. The point of intersection of the two lines is the point (3,1). This system of equations has one solution, the point (3,1) .
You Try It Graph the system of equations. Determine whether the system has one solution, no solution, or infinitely many solutions. If the system has one solution, determine the solution.
Problem 1 y x The two equations in slope-intercept form are: Plot points for each line. Draw in the lines. These two equations represent the same line. Therefore, this system of equations has infinitely many solutions .
Problem 2 y x The two equations in slope-intercept form are: Plot points for each line. Draw in the lines. This system of equations represents two parallel lines. This system of equations has no solution because these two lines have no points in common.
Problem 3 y x The two equations in slope-intercept form are: Plot points for each line. Draw in the lines. This system of equations represents two intersecting lines. The solution to this system of equations is a single point (3,0) .