Download
1 / 18
200 likes | 320 Vues
Learn about constant functions, linear functions, slope, y-intercept, and rates of change in this comprehensive lesson. Explore how to identify linear functions and calculate rates of change using ordered pairs and graphing. Familiarize yourself with different aspects of linear functions through practical examples and exercises.

E N D
Types of Functions, Rates of Change Lesson 1.4
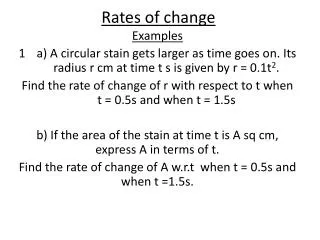
Constant Functions • Consider the table of ordered pairs • The dependent variable is the same • It is constant • The graph is a horizontal line
Linear Function • Can be represented by • Where a and b are constants • See Geogebra example
Slope and Y-Intercept • Considering y = m * x + b • The b is the y-intercept • Where on the y-axis, the line intersects • On your calculator • Go to Y= screen • Enter at Y1 (2/3) * x + 5 • Predict what the graph will look like before you specify F2, 6 for standard zoom
Family of Linear Functions • Slope = Rate of Change y=3x + 5 • Slope = m = 3 • y-intercept = b = 5
• Slope and Y-Intercept • The function y = (2/3) * x + 5 • Slope = 2/3 (up to the right) • Y-intercept = 5
Linear Functions • Consider this set ofordered pairs • If we plot the pointsand join them wesee they lie in aline • • • •
6 3 Rate of Change • Given function y = 3x + 5 • • • •
Rate of Change • Try calculating for differentpairs of (x, y) points • You should discover that the rate of change is constant … in this case, 3 GeogebraDemo
Slope • When slope = • Try y = -7x – 3(predict the results before you graph)
Family of Linear Functions • Calculating slope with two ordered pairs (X2, Y2) • (X1, Y1) • Given two ordered pairs, (7,5) and (-3,12). What is the slope of the line through these two points?
You may need to specify the beginning x value and the increment Rate of Change • Consider the function • Enter into Y= screen of calculator • View tables on calculator (♦ Y)
Rate of Change • As before, determine therate of change fordifferent sets of orderedpairs
Rate of Change (NOT a constant) • You should find that the rate of change is changing – NOT a constant. • Contrast to thefirst functiony = 3x + 5 GeogebraDemo
Function Defined by a Table • Consider the two functions defined by the table • The independent variable is the year. • Predict whether or not the rate of change is constant • Determine the average rate of change for various pairs of (year, sales) values
Warning • Not all functions which appear linear will actually be linear!! • Consider the set of ordered pairs • Graph them • Decide whether graphis linear • Check slope for differentpairs
Results • Graph appearsstraight • But …rate of change is not a constant
Assignment • Lesson 1.4 • Page 53 • Exercises 1 – 65 EOO