Download
1 / 56
560 likes | 585 Vues
Explore the progress in hydropower, solar, wind, and more for a sustainable energy future. Learn about technological innovations and the impact on electricity generation and environmental sustainability.

E N D
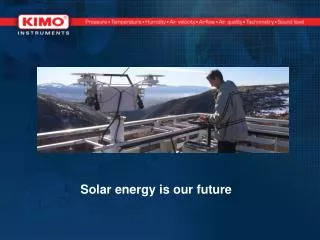
SC 203OUR ENERGY FUTURE-UPDATEDPROGRESS IN TECHNOLOGY The SLATE Panel GEORGE HUME Jan. 23, 2008
SUMMARY OF PRESENTATIONAPPROACH • Brief review of the Situation or Status as Presented last year, then Identify Significant Changes/Progress made since • Energy Subject Areas to be Covered: • Hydropower - Nuclear Energy • Solar - Waves and Tide • Wind - Alternative Fuel • Coal • Advances of Technologies for Automobile Energy Use and Environmental compatibility
Hydropower • Of the renewable energy sources that generate electricity, hydropower is the most often used. It accounted for 9+ percent of total U.S. electricity generation and 75 percent of generation from renewables in 2004 • Over one-half of the total U.S. hydroelectric capacity for electricity generation is concentrated in three States (Washington, California and Oregon) with approximately 27 percent in Washington, the location of the Nation’s largest hydroelectric facility – the Grand Coulee Dam
World-wide, about 20% of all electricity is generated by hydropower.
Trends Re Hydropower • Share of total electricity generation by hydropower could decline to 5.3% by 2030. (DOE, Energy Info. Admin.) - Very limited locations remain for major hydro dams, small yes - Public concern about environmental impacts of dams on fisheries and wildlife habitat. - Climate changes could impact water supply by reduced rain and snowfall • R and D is underway to improve hydropower technology - Improve fish survival rates - improve efficiency of generation
Solar Photovoltaic Electricity • Silicon wafers doped to form photovoltaic cells • Power is free, but • Large wafers still thick and crystal grown as chips, so still expensive • Cost still 3 to 10 times as expensive as fossil fuel power • Efficiency only 10 to 15%, so large areas needed • Daily and yearly average only 1/5 of maximum power capacity installed • Don’t need storage if send excess power back over the grid • Storage could be in charging car batteries or in hydrogen fuel, or • Concentrate on using more energy during the daytime • Silicon valley investigating thin film disk technology to make cheaper
California’s Million Solar Roofs • California SB1 (Senate Bill 1) to provide rebates to equip solar power installations • Goal is 3 gigawatts solar by 2017 • This could be 3 kw/household, at $9/watt is $27,000/household • Companies rebated per kwh generated • New homes must offer solar option by 2011 • 500,000 more homes can be added to generating electricity into the power network • $2.8 billion CA cost, 30% Federal rebate, up to $18 billion total cost, but for less average electricity than a nuclear plant at $2-3 billion. • Could only nearly pay if it brings down costs through economies of scale, • or if it leads to technological breakthrough through research and competition • Only $100 million for solar water heating
Solar Trough Mirrors • Suitable For Large Systems • Grid-connected Power • 30-200 MW size • Heats mineral oil to hundreds of degrees • Then vaporizes a fluid to drive a turbine
Dish with Sterling Engine • Modular • Remote Applications • Demonstration Installations • High Efficiency • Conventional Construction • Heat expands gas and drives piston
Solar Tower • Suitable For Large Systems • Grid-connected Power • 30-200 MW size • Potentially Lower Cost • Potentially Efficient Thermal Storage • Molten Salt heated, averages out solar input • Can store heat overnight
Cost Of Energy*(Max Lechtman) Trough Dish/Engine Tower 2000 11.8 17.9 13.6 2010 7.6 6.1 5.2 2020 7.2 5.5 4.2 2030 6.8 5.2 4.2 *Cents/kWh in 1997 $
WIND POWER • The most promising near-term renewable resource • U.S. installed capacity growing about 25% per year • Intermittent, irregular supply • Value depends on installed capacity, site specific capacity factor, and timing of generation (summer is more valuable than winter) • At greater than 20% of a grid’s supply, managing the grid becomes difficult and expensive. • Issue: What will happen when the subsidies vanish?
World Wind Capacity. Total now 74 Gigawatts worldwide, with 65% in Europe. Market growing at 32% a year. 3.3% of European electricity now from wind. 1% of U.S. electricity.
Wind Generation Physics • Power proportional to the cube of the wind velocity. • (v² from Bernoulli pressure for force on wingshaped propeller, times a distance per second of rotating propeller, which is proportional to v.) • Most of energy from small bursts. • ½ of energy comes in 15% of the time. • Average capacity factor is 35% of the maximum. • Wind turbines best spaced 3-5 times the rotor diameter perpendicular to the wind, and 5-10 times the diameter parallel to the wind.
Virginia’s “Switzerland” Wind Power Proposal • 39 towers of 400 feet height • $2 million per tower at 1 megawatt • So about a 40 megawatt peak project • Enough power for 15,000 homes x • 12,000 kwh/yr / 9,000 hours/year = • 20 million watts average • Implies a 50% duty cycle • To compare to a 1 gigawatt nuclear plant, would require 50 such projects, or about 2,000 wind towers and $2 billion.
England, Germany, Netherlands:10 Gigawatt Foundation Project • Proposal for 2,000 wind turbines of 5 megawatts each to make 10 gigawatts • Could power more than 8 million homes • Would cover 3,000 square kilometers • In the southern North Sea
TECHNOLOGIES • Horizontal axis fans are the best proven technologies • Windmills have been in use since the Middle Ages • New designs are proliferating • Issues • Mechanisms are complex and expensive to maintain • Large blades for efficient units are expensive to make and transport • Grid connection issues seem to be solved
SOME GENERAL ATTRIBUTES • Best where there is reliable strong wind: U.S. midwest and southwest • Adaptable to either centralized (wind farm) or decentralized siting • Siting issues: Martha’s Vineyard & Nantucket • Aesthetics, visibility– NIMBY • Noise • Electromagnetic interference • Banned within 1.5 miles of shipping/ferry lanes • Wild life fatalities: California, West Virginia • Low flying, migratory song birds (Altamount Pass) • Bats
WINDPOWER POTENTIAL FOR THE UNITED STATES • Battelle estimate: 20% of U.S. electricity demand with siting constraints • DOE goal to meet 6% of U.S. demand by 2020 • Unconstrained potential equivalent to operating ~1500 1000MWe nuclear or coal plants • States potential: North Dakota, Texas, Kansas, South Dakota, Montana—California is 17th • North Dakota could supply 25% of current U.S. electricity demand –need a major growth of electric (or hydrogen?) transmission capacity
WINDPOWER PROSPECTS • Big potential market: world capacity growing at 30% per year • Annual equipment sales ~ $2 billion in 2005 • Project financing for renewables in 2005 • Wind Power $ 3.5 billion • Solar Photovoltaic $ 2.2 billion • All other $ 1.25 billion • Major companies are involved • General Electric • British Petroleum • Goldman Sachs • J P Morgan chase • Siemens AG
CONTEXT OF OUR STUDY • Nuclear power (fission) is an economically viable energy source • PROBLEM: Many U.S. citizens have a negative attitude toward nuclear power. The three W’s: Worries, Waste and Weapons. • QUESTION: What must be done to address the problem so that we can employ nuclear power to: • Meet our increasing demand for electric power? • Reduce our greenhouse gas emissions?
SOME IDEAS FOR ALTERNATIVE DESIGN APPROACHES • Use of hybrid fuel assemblies containing both uranium and Thorium - More complex at construction but keeps most of fuel in reactor longer and produces less toxic waste • Use of “small”, “self-contained”, “factory built” reactors about size of railroad car. Produces enough electricity for 35,000 homes
PROGRAMS THAT WILL IMPACT the FUTURE OF NUCLEAR POWER • Nuclear Power 2010: Government-industry cost sharing effort to identify sites, develop new plant technologies and demo. untested regulatory procedures • Global Nuclear Energy Partnership: US and other advanced nations develop fuel market, spent fuel recycling technology and reduce proliferation risks • Generation IV: International initiative to develop 6 next-generation reactors that are safer, more reliable, more cost-effective, and more proliferation resistant. • ITER: International R&D project to demo. Scientific and technical feasibility of commercial fusion power.
POWER FROM TIDES AND CURRENTS • Technical Approaches • Tidal dams (barrages) • Tidal fences • Turbine fields • Common features • Generate electricity using water driven fans or turbines • Low operating costs if avoid storm damage/biofouling • High construction costs • Various negative impacts on marine environment
TIDAL BARRAGES • Dams across estuaries with gates to control water flow and hydroturbine generators to produce electricity • Depend on minimum tidal difference of 16 feet—perhaps 40 sites in the world • The LaRance facility has operated reliably for many years • Possible sites in Pacific Northwest and Atlantic Northeast • Cause silting, destroy wetlands and interfere with fish migrations • Probably of limited potential for the U.S.
AXIAL FLOW HYDRO TURBINES • Technology is in very early stage • Installations look like underwater wind farms • Ideally in rivers or near shore at depths of 60-100ft • High capital cost: $4300/KWe • U.S. potential is speculative: equivalent to 12 to 170 coal-fired (1000MWe) plants? • Demonstration project in Manhattan’s East River—6 turbines, 200KWe in 2006
POTENTIAL FOR TIDAL TURBINES IN US • Tidal locations (120): 1200 MWe • Riverine locations: 12,500-170,000 MWe • Gulf Stream: 685,000 MWe • Fragmented industry with no major industrial firms • Demonstration in 2006: Manhattan’s East River, 6 turbines, 35 rpm, 200 KWe by Verdant Power • For discussion see: Proceedings of the Hydrokinetic and Wave Energy Technologies Technical and Environmental Issues Workshop Oct. 26-28, 2005 http://hydropower.inl.gov/
WAVE ENERGY • Several technical approaches • Floats or pitching devices • Oscillating water columns • Wave surge focusing devices • Demonstration installations in Great Britain (oscillating water column) and off Portuguese coast (floats) • Issues • Storm damage • Biofouling • Grid connection and power conditioning • Wave damping (surfers) • Potential: 7% of current U.S. electricity demand (EPRI)
WAVE ENERGYTECHNICAL APPROACHES • Floats or pitching devices: wave action moves two or more bodies relative to one another—various devices generate power; energy storage in supercapacitors since voltage/current are wildly erratic • Oscillating water columns: wave action drives air in and out of column—power is generated by an air turbine in the column • Wave surge or focusing devices: wave action drives water up a channel into a reservoir—power is generated by hydro turbines during outflow from reservoir
WAVE ENERGY POTENTIAL • Designs range from distributed generation to large scale power plants • Susceptibility to storm damage and biofouling are issues • Power conditioning and grid connection are also issues • EPRI estimate: at 60 m off US coast the average wave power is 2100TWH/Year • Could generate 7% of current US electricity demand by capturing 20% of the total wave energy at 50% efficiency.
TECHNOLOGY TO PERMIT SOME CONTINUED USE OF COAL • Supply of residual coal and large investment in legacy generation plants suggest continued major use • Advanced clean coal technologies: supercritical, ultra-supercritical, adv. Pulverized coal combustion, circulating fluidized bed, and integrated gasification combined cycle (IGCC). • Coal and utility industries are working with DOE and EPRI on “clean coal power” projects • Clean Coal Power Initiative (CCPI) - cost-share on demo projects • FutureGen Project- build first coal based-emissions free gen, plant • Coal Fleet for Tomorrow-work on IGCC and adv. Plant designs • CO2 Capture Pilot- test of a capture plant prototype in Wisconsin
NEW NATIONAL LAWS THAT RELATE TO BIO. ALTERNATIVE FUELS • The Energy Independence and Security Act of 2007 (signed in late Dec. 2007): • - Creates Renewable Fuel Standard (RFS) that requires: • Production of 36 billion gallons of renewable fuels by 2022 • That includes 21 billion gallons of adv. Biofuels (~ cellulosic biofuels) • Biofuels to be ~20% of road-transportation fuels by 202 • This requirement is a MAJOR challenge because: • Total biofuel production in 2007 was only about 4.7 billion gallons • There is still NO commercial production of cellulosic ethanol
COMPARATIVE COSTS TO REDUCE FOSSIL FUEL USE AND GHG WITH BIOFUELS
RESEARCH AREAS RELATED TO ADVANCING ALTERNATIVE FUELS • Ethanol - use genomics and synthetic biology to improve ethanol production, improve pretreatment and enzymes for cellulosic ethanol, learn from Termite guts, etc. • Butanol -engineer microbes that can convert sugar from various feedstocks into butanol • Waste to Fuel - Possible military use of a gasifier and fuel reactor to convert any carbon containing material into a mix of carbon monoxide and hydrogen • Carbon Dioxide to Fuel - “reversing combustion” could lead to hydrogen, methanol and gasoline. • Fischer-Tropsch liquid fuel from coal.
Conclusions • “All renewable energy is local” Adapt to locally available sources of renewable energy • Energy conservation is still the cheapest form of making energy available • In California, solar water heating is the next cheapest source of energy • Hydro should be maintained • Solar arrays are efficient and should be supported • Wind power is about the cost of nuclear. Have to find the right location. Siting a problem with views, noise, birds. • Nuclear power is omitted from renewable, but should be included as it also is non-polluting for greenhouse gases. • Solar photovoltaic needs more research and improvement, and is currently a wasteful investment.
HYBRIDS as an EXAMPLE of ADVANCED TECH. For AUTOS What are they? How are they different? Why should we be interested? What are their primary characteristics? What is the situation on Plug-In Hybrids? What may be future trends? George Hume, OLLI @ UCI November 2007
DEFINITION AND BACKGROUND OF HYBRIDS • DEFINITION: A hybrid is a vehicle that uses two or more distinct power or fuel sources. Often the vehicles use a combination of internal combustion engines and electric motors. • BACKGROUND: The concepts and designs for hybrids have TRUE or been developed in just the last decade. FALSE