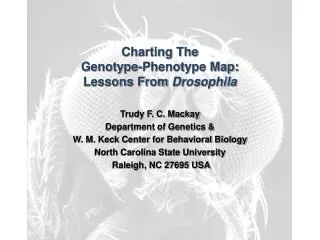
Charting The Genotype-Phenotype Map: Lessons From Drosophila
590 likes | 850 Vues
Charting The Genotype-Phenotype Map: Lessons From Drosophila. Trudy F. C. Mackay Department of Genetics & W. M. Keck Center for Behavioral Biology North Carolina State University Raleigh, NC 27695 USA. Evolutionary Quantitative Genetics.

Charting The Genotype-Phenotype Map: Lessons From Drosophila
E N D
Presentation Transcript
Charting The Genotype-Phenotype Map: Lessons From Drosophila Trudy F. C. Mackay Department of Genetics & W. M. Keck Center for Behavioral Biology North Carolina State University Raleigh, NC 27695 USA
Evolutionary Quantitative Genetics • What maintains variation for quantitative traits within populations? • Do the same loci causing variation within populations also cause divergence between populations? Between species? • How predictable is evolution?
Quantitative Traits Genetic Variation Environmental Variation Gene-Environment Interaction and Correlation
AACTGGCCTCCTCCTCCTCCTATACGTTACCGG………………….CGATTCCAAAAACTGGCCTCCTCCTCCTCCTATACGTTACCGG………………….CGATTCCAAA AACTGGCCTCCT……………….ATACGTTACCGG………………….AAACCTTAGC AACTGGCCTCCT……………….ATACGTTACCGC………………….AAACCTTAGC AACTGGCCTCCT……………….ATACGTTACCGC……..3kb……..AAACCTTAGC
Genetic Resources Genetic Manipulation Model Organism
Drosophilamelanogaster Genetic Reference Panel (DGRP) Natural Population Raleigh NC, USA Isofemale Lines 20 Generations FS Inbreeding 205 Inbred Lines 192 • Living library of genetic variation • Community resource for association mapping complex traits • Replicated genotypes • Accurate phenotypes, multiple phenotypes (pleiotropy), multiple environments (GEI) • Freeze 1 genome sequences of 168 lines Mackay et al. 2012. Nature 482:173
H2 = 0.43 H2 = 0.56 H2 = 0.58
Freeze 2 Molecular Variation in DGRP Lines • Freeze 2 Genotyping • 205 lines sequenced on Illumina platform • Initial variant discovery using 7 existing callers • Global list of variants grouped into haplotype bins • Reads re-aligned to haplotypes to count supporting and opposing reads • Final genotypes called by the Joint Genotyper for Inbred Lines (JGIL), which computes a quality score for each genotype and for each variant The Numbers SNP/MNPs 3,976,011 Indels 462,416 Polymorphic microsatellites 23,754 Potentially damaging variants 6,523 Site Frequency Spectra * Minor alleles are grouped to calculate MAF
Potentially Damaging Variants in DGRP Lines • Potentially damaging annotations: SPLICE_SITE, START_LOST, EXON_DELETED, FRAME_SHIFT, STOP_GAINED, STOP_LOST • Hundreds of genes affected per line • Large gene families enriched for affected genes (e.g. olfactory receptors) • Novel alleles for functional analysis
Variation in Genome Size in DGRP Lines Reference Strain
Other Information • Wolbachia infection status of each DGRP line • Cytogenetic analysis of polymorphic inversions: • In(2L)t • In(2R)Nova Scotia • In(3L)Payne • In(3R) Mourad • In(3R)Payne • In(3R)Kodani • In(3R)C
Rapid Local LD Decay Mackay et al. 2012. Nature 482:173
Association Analyses No Association Association Phenotypic Value Phenotypic Value A T A T http://dgrp.gnets.ncsu.edu/ Faster GWAS GWAS includes Wolbachia, inversions, relationship matrix Latest FlyBase annotations of variants
GWAS in the DGRP: Starvation Resistance Most significant SNPs are low frequency Standardized effects not small Many significant SNPs (FDR < 0.1) Many sex-specific effects Novel genes Local LD Mackay et al. 2012. Nature 482:173
Relationship Between Effect Size and MAF Mackay et al. 2012. Nature 482:173
R_Spider Analysis of Ethanol Sensitivity GWAS www.BioProfiling.de TV Morozovaet al., unpublished Axon guidance Protein phosphorylation Purine metabolism Neurotransmitter secretion G-protein coupled receptor
Additive Multi-SNP Model Explains Most Variation Startle Response r2 = 0.72 Chill Coma Recovery r2 = 0.84 Starvation Resistance r2 = 0.81 Mackay et al. 2012. Nature 482:173
But Predictive Ability is Low *GBLUP, 5-fold cross validation; ~2.5 million common SNPs • Small sample size? • Rare alleles? • Alleles with large effects? • Non-additive genetic variation? Oberet al. 2012. PLoS Genetics 8: e1002685
Testing Multi-Locus Predictions: Flyland Round robin mating 40 DGRP lines Starvation resistance Startle response Chill coma recovery Random mating 70 generations N= 800/generation Flyland Population 6 libraries/pool 300X depth/pool Huang et al., PNAS 109: 15553
Complex Genetic Architecture in Flyland 276 SNPs, PBonferroni < 0.05 61 SNPs, PBonferroni < 0.05 320 SNPs, PBonferroni < 0.05 Huang et al., PNAS 109: 15553
SNP Effects Not Small Huang et al., PNAS 109: 15553
No Replication between Flyland and DGRP Huang et al., PNAS 109: 15553
No Replication Between Flyland and DGRP: Not From Different P-value Thresholds Huang et al., PNAS 109: 15553
No Replication between Flyland and DGRP: Effects Not Correlated Huang et al., PNAS 109: 15553
No Replication between Flyland and DGRP: SNPs not in LD Huang et al., PNAS 109: 15553
No Replication between Flyland and DGRP: Epistasis Huang et al., PNAS 109: 15553
Epistatic Networks Reveal Common Interacting Genes Huang et al., PNAS 109: 15553
Interconnected Networks of Common Interacting Genes Starvation Resistance Chill Coma Recovery SNPs context-dependent, network architecture conserved Huang et al., PNAS 109: 15553
Epistatic Interaction Networks Enriched for Known Genetic Interactions www.BioProfiling.de Starvation Resistance P < 0.005 Lipid metabolism Signal transduction Huang et al., PNAS 109: 15553
Epistatic Interaction Networks Enriched for Known Genetic Interactions www.BioProfiling.de Nervous system development, locomotion Nervous system function Chill Coma Recovery P < 0.05 Huang et al., PNAS 109: 15553
General Strategy 1. Test for interactions between SNPs that do not replicate in different populations, reciprocally in each population 2. Within a population: pairwise search for epistasis using GWAS SNPs as focal SNPs 3. Within a population: Identify SNPs with different allele frequencies between extremes of quantitative trait distribution; use these as focal SNPs for pairwise GWAS
A Paradigm Shift? H2 = 0.43 Is this a lot of variation? Or too little given molecular diversity? (~4 Million SNPs + non-SNP variants) H2 = 0.56 Additive SNP effects may be underestimated if they interact epistatically but the model does not include epistasis Has the genome evolved to suppress effects of deleterious mutations? H2 = 0.58 Epistatic interactions = genetic basis of canalization (homeostasis)
Evidence for Epistasis From h2 (Realized) and H2 Mackay et al. 2005, PNAS 102: 6622-6629; Edwards et al. 2006, PLoS Genetics 2: 3154; Jordan et al. 2007, Genome Biol. 8: R172; Morozovaet al. 2009, Genetics 83: 733-745; Ayroleset al. 2009, Nat. Genet. 41: 299-307; Edwards et al. 2009, Genome Biol. 10: R76; Morozovaet al. 2009, Genetics 83: 733-745
Evidence for Epistasis From h2 (GBLUP) and H2 • Apparent additivity • Estimates of VA include VAA • Epistasis from change of magnitude of effects in different backgrounds Chill Coma Recovery Starvation Resistance Startle Response • Largely epistastic • Epistasis from change of direction of effects in different backgrounds
Hypothesis IF • Extensive epistatic interaction networks suppress allelic effects in outbred populations THEN EXPECT • Large numbers of induced mutations in a single inbred background affect quantitative traits (decanalization) • The same mutations have different effects in different genetic backgrounds • Mutations affecting the same trait perturb the same underlying network and interact epistatically • Response to selection from mutations affecting the same trait will be less than expected based on homozygous and heterozygous effects • Natural variants suppress (buffer) effects of newly induced mutations
2 3 1 P-Element Mutagenesis in Drosophila Magwireet al. 2010, PLoS Genetics 6: e1001037
Large Numbers of Induced Mutations Affect Quantitative Traits? 23.3% 6.2% 21.9% 32.7% 34.7% Dilda & Mackay 2002, Genetics 162: 1655; Norgaet al. 2003, Curr. Biol. 13: 1388-1397; Harbisonet al. 2004, Genetics 166: 1807-1823; Sambandanet al. 2006, Genetics 174: 1349-1363; Yamamoto et al. 2008, PNAS105: 12393-12398; Edwards et al. 2009, BMC Biology 7: 29; Magwireet al. 2010, PLoS Genetics 6: e1001037; Morozovaet al. 2011, Genetics 187: 1193-1205 41.1% 24.8% 37.1%
Same Mutations Have Different Effects in Different Genetic Backgrounds? Magwireet al. 2010, PLoS Genetics 6: e1001037
× Mutations Affecting the Same Trait Interact Epistatically? Federowiczet al. 1998, Genetics 148: 1885-1891
CG10990 crol BG00817 BG00004 BG00297 mub CG9238 pyd esg CG31531 Mutations Affecting the Same Trait Interact Epistatically? CG10990 crol BG00817 Males Females BG00004 Startle Response Olfactory Behavior BG00297 mub CG9238 Life Span pyd esg CG31531 Sambandanet al. 2006, Genetics 174: 1349-1363; Yamamoto et al. 2008, PNAS105: 12393-12398; Magwireet al. 2010, PLoS Genetics 6: e1001037