Download

1 / 25
250 likes | 466 Vues
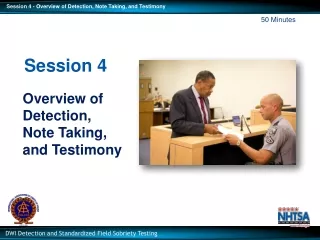
Learn To Trade Session 4. Intermarket Analysis. Today we’ll explain the relationships between global markets, and more importantly, how to start trading them!. Trading Like The Coyote. I.P.A Trading Methodology. I ntermarket Analysis P attern Recognition A .R.T. Management.

E N D
Learn To Trade Session 4 Intermarket Analysis Today we’ll explain the relationships between global markets, and more importantly, how to start trading them!
I.P.A Trading Methodology • Intermarket Analysis • Pattern Recognition • A.R.T. Management
Leading or Lagging? Fundamental Analysis- the study of backward looking economic figures to anticipate future economic performance, then infer future market direction Technical Analysis – the study of forward looking market prices and trends that discount future economic performance ?
Intermarket Analysis • Observation of market prices of 2 or more fundamentally related markets • Determines a leading, lagging, or coincident relationship. • Confirms or refutes the textbook economic relationship • Reduces ambiguities of single-chart technical analysis • Increases conviction of trade setup
Credit Crisis Correlations2008-2011 Stock Market US Dollar $
“Post” Crisis Correlations2011-20?? Stock Market US Dollar $ But Why….?!
Current Market Correlations US Dollar $ Stock Market US Bond Yields US Bond Prices
Commodities & Metals Bullish Commodities represent ‘RISK ON’ Bearish Commodities represent ‘RISK OFF’ Oil – WTI Futures West Texas Intermediate oil futures are trade at the Chicago Mercantile Exchange (CME). Copper Futures Copper prices are often considered a forward indicator for growth per its demand in construction. Gold & Silver Gold & silver have inconsistent with relation to macro flow. But responds well to Fed policy
Shanghai 1990 Shanghai 2010
China – Aussie - Copper The Australian Dollar (AUD) is positively correlated to ‘Working Metals’ (Copper, Iron, Nickel, etc). This relationship exists through the recent demand from China for construction materials. Australia’s proximity to China makes it a prime trading partner to fill China’s massive demand. It should also be noted that if China’s growth slows it would cause metals prices to decline and therefore the Australian Dollar. Forex trading involves significant risk of loss and is not suitable for all investors. Past performance is not indicative of future results.
Current Market Correlations ? US Dollar $ Stock Market US Bond Yields US Bond Prices WTI Crude
The Tools of I.M.A • Quote Sheet • Nominal Price Overlay • % Change Overlay • Ratio Analysis • Elliott Wave Filtering with IMA • Comparison of primary / alternate count with IMA • Indicator analysis on bottom panel