Download
1 / 28
280 likes | 386 Vues
Cost of Capital. Dr Bryan Mills. Risk and Return. % return. % risk. Order of risk. Treasury bills and gilts (risk free) Loan Notes But ranked from AAA to BBB – with specialist ‘junk bonds’ being BB and less Equity. Dividend Valuation Model.

E N D
Cost of Capital Dr Bryan Mills
Risk and Return % return % risk
Order of risk • Treasury bills and gilts (risk free) • Loan Notes • But ranked from AAA to BBB – with specialist ‘junk bonds’ being BB and less • Equity
Dividend Valuation Model • Share price must be equal to or less than future cash flows: • We can assume that D’s growth will be constant. (geometric progression).
P Dividend Stream Cum Div P0 Time Assumptions • Uses next year’s dividend so must be ex div • Fixed rate of growth • Dividends paid in perpetuity • Share price is discounted future cashflow
Dividend growth: • Either old dividend divided by new dividend and answer looked up on discount factor table for that number of years or;
Example: • If a company now pays 32p and used to pay 20p 5 years ago what is the rate of growth? • 20(1+g)n = 32 • (1+g)n = 32 • 20 • 1 + g = (1.60)1/5 • 1 + g = 1.1 • growth is 10%
Gordon’s Growth Model • Balance sheet asset value of £200, a profit of £20 in the year and a dividend pay out of 40% (in this case £8) we would expect the new balance to be £212 (old + retained profit). • If the ARR and retention policy remain the same for the next year what will the dividend growth be? • Profit as a % of capital employed is £20/£200 = 10% • Next year has the same ARR then: • 10% X £212 = £21.20 is our new profit • as the dividend is 40% this equates to: • 40% X £21.20 = £8.48 • Which represents a growth of (8.48-8)/8 = 6% • Which could have been found much quicker (!) by: • g = rb, g = 10% X 60%, g = 6%
Test • Share price is £2, dividend to be paid soon is 16p, current return is 12.5% and 20% is paid out – what is cost of equity? • g is rb – refer back to DVM for cost of equity
Rate of Return Investment A Investment B Time Rate of Return Combined effect (Portfolio Return) Time Portfolio theory
Systematic risk Portfolio Risk Unsystematic (unique) Risk Systematic (Market) Risk 15-20 Number of securities
Return Security Market Line (SML) Rm Rf 1 Systematic Risk CAPM
Rf = Risk Free therefore = 0 • Rm = Market Portfolio (max diversification - all systematic) therefore = 1 • SML can be written as an equation: • Rj = Rf + j(Rm - Rf) • Called CAPM
Ry Slope = >1 Market Return Rm Ry Slope = <1 Market Return Rm
Test • Paying a return of 9%, gilts are at 5.5% and the FTSE averages 10.5% - what is the beta – and what does this value mean?
Aggressive and Defensive Shares • If the risk free rate is 10% and the market index has been adjusted upward from 16% to 17% what will be the effect on shares with Betas of 1.4 and 0.7 accordingly? • Shares with Betas greater than 1 are aggressive - they are over-sensitive to the market • Shares with Betas less than 1 are defensive - they are under-sensitive to the market
Assumptions of CAPM • perfect capital market • unrestricted borrowing at the risk free rate • uniformity of investor expectations • forecasts based on a single time period • Advantages of CAPM: • provides a market based relationship between risk and return • demonstrates the importance of systematic risk • is one of the best methods of calculating a company's cost of equity capital • can provide risk adjusted discount rates for project appraisal
Limitations of CAPM: • avoids unsystematic risk by assuming a diversified portfolio - how reliable is this? • Only looks at return in the most simple of ways (rate of return not split into growth, dividends, etc.) • Only based on one-period • Can be difficult to estimate Rf Rm • Does not work well for investments that have low betas, seasonality, low PE ratios - partly because it overstates the rate of return needed for high betas and understates the rate needed for low betas
Irredeemable Securities: • In this case the company never returns the principal but pays interest in perpetuity. • An equation we have seen before with I (interest) replacing the dividend (D) • Note that tax relief relates to the company and not the market value
Redeemable Securities: • Debenture priced at £74 with a coupon of 10% (remember this is 10% of £100). The interest has just been paid and there are four years until the redemption (at par) and final interest are paid. • IRR of cashflows
Interesting point: • Debt redeemable at current market price has the same cost (and formula) as irredeemable debt
Others • Convertible • Redemption value is higher of cash redemption or future value of shares • Non-tradable debt • ‘normal’ loans – just use (1-t) • Preference sahres • Not really debt but use D/P
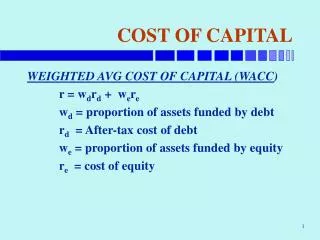
WACC • Step by Step Approach: • Calculate weights for each source of capital (source/total) • Estimate cost of each source Multiply 1 and 2 for each source • Add up the result of 3 to get combined cost of capital
Cost of equity Cost of Cap % WACC Cost of debt 0 X Gearing WACC
£ Market value of equity 0 X Gearing Market Value of firm
Market value • MV of company = Future Cash Flows • WACC