
Understanding the Beer Consumption Pattern Among Drinkers and Bars
This document analyzes the relationships between drinkers, bars, and beers based on an entity-relationship (ER) schema. It outlines the frequencies at which drinkers visit certain bars and their preferences for specific beers. By examining instances such as Joe and Sally's beer choices, we can gain insights into consumption patterns. This ER diagram can help in checking relationships between drinkers and their favorite bars or beers, enabling stakeholders to understand market preferences and trends in beer sales better.

Understanding the Beer Consumption Pattern Among Drinkers and Bars
E N D
Presentation Transcript
R3( A, R1.B, R2.B, C ) 1 2 5 6 1 2 7 8 1 2 9 10 3 4 5 6 3 4 7 8 3 4 9 10 Example: R3 := R1 × R2 R1( A, B ) 1 2 3 4 R2( B, C ) 5 6 7 8 9 10
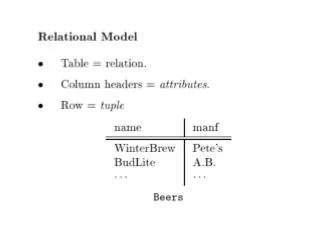
name addr name manf Bars Beers Sells Bars sell some beers. license Drinkers like some beers. Frequents Likes Note: license = beer, full, none Drinkers frequent some bars. Drinkers name addr The schema as an ER-diagram
to output check for Joe check these are equal drinker bar drinker beer tv1 tv2 Sally Bud Sally Joe’s Likes Frequents