Dynamic Air Pollution Prediction System (DAPPS) for Effective Air Quality Management
150 likes | 261 Vues
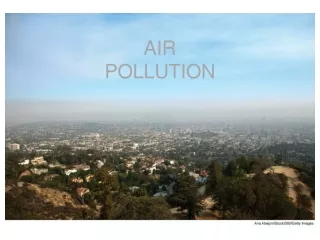
DAPPS is an innovative project aimed at enhancing air quality management in South Africa through advanced modeling and monitoring systems. The project, supported by the Department of Arts, Culture, Science, and Technology, invites South African partners for a three-year collaboration. Key components include comprehensive emissions inventory compilation, meteorological forecasting, photochemical dispersion modeling, and interactive web-based tools. DAPPS will enable accurate, continuous monitoring of air pollution, providing essential data to manage health risks linked to air quality effectively. Stakeholder involvement is crucial for project success.

Dynamic Air Pollution Prediction System (DAPPS) for Effective Air Quality Management
E N D
Presentation Transcript
Mark Zunckel & Eugene Cairncross CSIR Pen Technikon SAWS SRK A Dynamic Air Pollution Prediction SystemDAPPS
Innovation Fund • Dept Arts, Culture, Science & Technology • Call for consortia • South African partners • Large projects, e.g. 3-years • Contribution in specified key areas, e.g. biotechnology, technology & information
Air Quality Management Sources Management Intervention Chemistry Transport Deposition Dispersion Receptor impact Ambient concentrations Modeling or monitoring
Air Quality Monitoring • Site specific • Selected pollutants • Accurate • Continuous • Expensive • Can be integrated with modelling
Air Quality Modelling • Spatially continuous • A range of pollutants • Estimation of concentrations • Average concentrations • Cost effective • Integrated with monitoring
DAPPS • Sources: Compile a comprehensive emissions inventory • Meteorology: SAWS forecast fields • Dispersion: Photochemical dispersion model • Receptors: Spatially resolved grid • Forecast map of air pollution data and indicators • Information to manage air quality
High • Medium
Communicating the forecast • Air pollution data and indicators • Map of an area with a number scale or color scale indicating potential health risk • Interactive web site, updated ever 24 hours • Daily newspaper? Other methods?
What DAPPS will not do! • DAPPS will have limitations • Quality of input data • Uncertainty in meteorological predictions • Assumptions in dispersion model • Spatial resolution • Scenario modelling • DAPPS cannot manage air quality
Validation of the system • Meteorological forecast On going validation at SAWS • Source model Point sources Mobile sources Domestic sources • Dispersion model Comparison of estimations with monitored data
Project structure • 3 year research & development project • Number of specialist components to be developed and integrated with one another • Maintain a two-way communications with a number of stakeholders
Project Plan • Year 1: Project launch, components of DAPPS system running independently • Year 2: Integration of the components • Year 3: DAPPS running in test location • Stakeholder involvement throughout the development
Potential sites: Durban (SIB) Richards Bay PE/Coega Cape Metro Vaal Triangle Platinum Area Pietermaritzburg Criteria for selection: Stakeholders buy-in Data availability Digital information Issue (s) Range of source types History /other work Isolation from sources Local by-laws Running costs Complex meteorology Why Cape Town?
Conclusion We believe that we can develop a system to assist in the management of air quality & CMC is our prefered development site To make it happen, we need: • Your buy-in as key stakeholders, • Your input now to help specify the outputs of the system; to influence the design of the system, • Your input throughout the system development.