
Uploaded by
cleave
1 SLIDES
176 VUES
10LIKES
100
DESCRIPTION
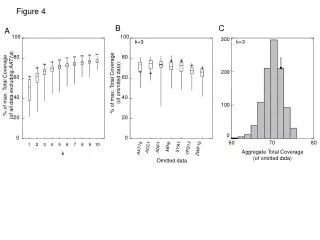
Figure 4. B. C. A. 100. 100. 300. k=3. k=3. 80. 80. 200. 60. 60. % of max. Total Coverage (of ommited data). % of max. Total Coverage (of all data excluding AAT1a ). 40. 40. 100. 20. 20. 0. 0. 0. 60. 70. 80. 1. 2. 3. 4. 5. 6. 7. 8. 9. 10. MPIb. SYA1. ADP1.
Download
1 / 1
Télécharger la présentation 
100
An Image/Link below is provided (as is) to download presentation
Download Policy: Content on the Website is provided to you AS IS for your information and personal use and may not be sold / licensed / shared on other websites without getting consent from its author.
Content is provided to you AS IS for your information and personal use only.
Download presentation by click this link.
While downloading, if for some reason you are not able to download a presentation, the publisher may have deleted the file from their server.
During download, if you can't get a presentation, the file might be deleted by the publisher.
E N D
Presentation Transcript
Figure 4 B C A 100 100 300 k=3 k=3 80 80 200 60 60 % of max. Total Coverage (of ommited data) % of max. Total Coverage (of all data excluding AAT1a) 40 40 100 20 20 0 0 0 60 70 80 1 2 3 4 5 6 7 8 9 10 MPIb SYA1 ADP1 ACC1 VPS13 AAT1a ZWF1b Aggregate Total Coverage (of omitted data) k Omitted data


More Related