Download
1 / 2
Analysis of Nutrient Concentrations in Various Samples
30 likes | 141 Vues
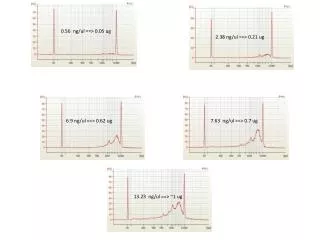
This report presents a detailed analysis of nutrient concentrations in different samples, measured in nanograms per microliter (ng/ul) and micrograms (ug). The data highlights a range of values including 0.56 ng/ul, 0.05 ug, 0.21 ug, 0.62 ug, and others, indicating the presence of key nutrients essential for various biological applications. This analysis aims to provide insights into nutrient levels for further research and applications in fields such as biochemistry and environmental science.
Télécharger la présentation 
Analysis of Nutrient Concentrations in Various Samples
An Image/Link below is provided (as is) to download presentation
Download Policy: Content on the Website is provided to you AS IS for your information and personal use and may not be sold / licensed / shared on other websites without getting consent from its author.
Content is provided to you AS IS for your information and personal use only.
Download presentation by click this link.
While downloading, if for some reason you are not able to download a presentation, the publisher may have deleted the file from their server.
During download, if you can't get a presentation, the file might be deleted by the publisher.
E N D
Presentation Transcript
0.56 ng/ul ==> 0.05 ug 2.38 ng/ul ==> 0.21 ug 6.9 ng/ul ==> 0.62 ug 7.63ng/ul ==> 0.7 ug 13.23ng/ul ==> ~1 ug
1.84 ng/ul ==> 0.17 ug 3.9 ng/ul ==0.4 ug 6.86ng/ul ==> 0.62 ug 6.67 ng/ul ==> 0.6 ug 3.57ng/ul ==> 0.3 ug
More Related