Download
1 / 51
510 likes | 618 Vues
Gallons of Oil per Barrel 42 U.S. Crude Oil Production 5,178,000 barrels/day U.S. Crude Oil Imports 10,126,000 barrels/day Top U.S. Crude Oil Supplier Canada - 1,633,000 barrels/day U.S. Petroleum Product Imports 3,588,000 barrels/day

E N D
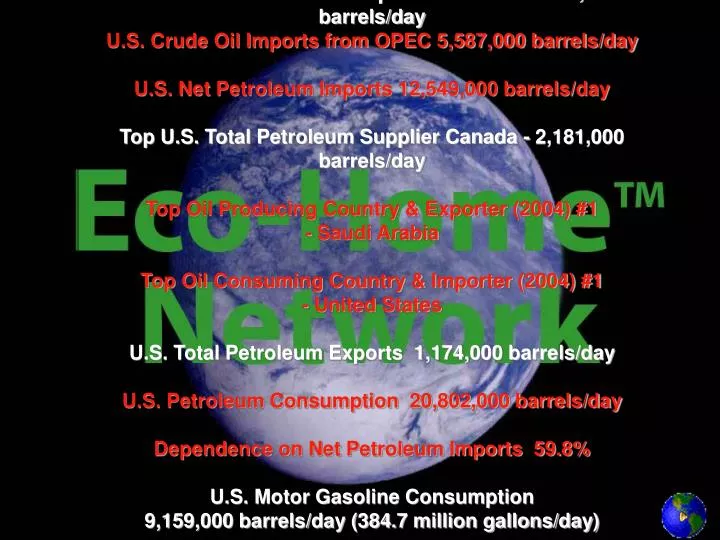
Gallons of Oil per Barrel 42 U.S. Crude Oil Production 5,178,000 barrels/day U.S. Crude Oil Imports 10,126,000 barrels/day Top U.S. Crude Oil Supplier Canada - 1,633,000 barrels/day U.S. Petroleum Product Imports 3,588,000 barrels/day U.S. Petroleum Product Imports from OPEC 771,000 barrels/day U.S. Crude Oil Imports from OPEC 5,587,000 barrels/day U.S. Net Petroleum Imports 12,549,000 barrels/day Top U.S. Total Petroleum Supplier Canada - 2,181,000 barrels/day Top Oil Producing Country & Exporter (2004) #1 - Saudi Arabia Top Oil Consuming Country & Importer (2004) #1 - United States U.S. Total Petroleum Exports 1,174,000 barrels/day U.S. Petroleum Consumption 20,802,000 barrels/day Dependence on Net Petroleum Imports 59.8% U.S. Motor Gasoline Consumption 9,159,000 barrels/day (384.7 million gallons/day) Share of US Oil Consumption for Transportation (2004) 67% Number of U.S. Operable Petroleum Refineries 149 Top U.S. Petroleum Refining States #1 - Texas 4,241,000 barrels/day U.S. Proved Reserves of Crude Oil as of December 31, 2004 21,371 million barrels Top U.S. Oil Fields as of December 31, 2004 Prudhoe Bay, AK Top U.S. Producing Companies as of December 31, 2004 BP - 827,000 barrels/day U.S. Strategic Petroleum Reserve 685 million barrels Total World Oil Supply 84,338,000 barrels/day Total World Petroleum Consumption 83,840,000 barrels/day Energy information administration
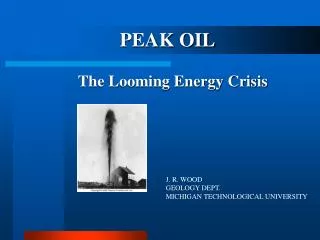
July 3, 2001, 12:45 pm EDT BUSH PLANS OIL AND GAS DRILLING IN GULF OF MEXICO Interior Secretary Gale Norton announced yesterday plans to open 1.47 million acres of the eastern Gulf of Mexico to oil and natural gas exploration. http://www.msnbc.msn.com/id/14732611/
http://maps.grida.no/go/graphic/temperature_trends_and_projections1http://maps.grida.no/go/graphic/temperature_trends_and_projections1
Signs and Symptoms of Contamination • Global Warming – Temperature Increase • Ozone Depletion & Solar Radiation changes • Water Pollution & Disease • Air Pollution • Soil contamination – erosion • Species Overpopulation /extinction ecosystem imbalance • negligent extraction of Natural resource • Non-renewable resource consumption / shortage • Limited natural resources • Civil, political, economic and military confrontation.
Typical hazards introduced when BUILDING A HOME • CONSTRUCTION MATERIALS OUTGASSING • BURN FUEL INSIDE BUILDING • FINISHED BASEMENTS • GARAGES IN BUILDINGS • LEAKY MECHANICAL SYSTEMS IN BASEMENTS OR ATTICS • THE MISER SYNDROME
What is building Green? • Environmental responsiveness • Resource Efficiency • Community and Cultural sensitivity • Integration of ecology and real estate • Energy, Indoor air quality, materials, water conservation, appliances • Sustainable sites, atmosphere, Innovation and design process.
Sustainability • The ability of society to continue without being forced into decline through the exhaustion or overloading of the resources on which it depends. American institute of architects
Life Cycle Assessment Source: U.S. Department of Energy High Performance Buildings Database
Expense of Building Green • Long term vs. short term costs • Cost trade-off • $ upgrade…….long term pay-off utility bills
Conventional - Built homes 1,600 sf x $130/sf = $208,000 Green built homes 1,600 sf x $156/sf = $249,600 Architect engineering permit fees Cost Comparison
Conventional Ave. Electric/fossil fuel monthly bill = 250/month + 5%/yr inflation = $199k over 30 years combined energy payments in 2034 $1029/month Green Ave. Electric/fossil fuel monthly bill = 250/month x 60% (40% energy savings) = $150/ month + 3%/yr inflation = $86k over 30 years combined energy payments in 2034 $354/month Conventional vs Green
NYS Tax Credits • $25 million income tax credit • Program life-9 years • Tax credit spread over five years • High but obtainable standards for building green
Where the money is…… • Base building: 5% of allowable costs, up to $7.50/ sf • Tenant space: 5% allowable Costs, up to $3.75/ sf
More Incentives • Fuel cells • 30% inst costs • Max $1,000/ kw of dc rated capacity Photovoltaic's 100% of incremental costs of BIPV 25% costs of non-BIPV cap of $3/W of DC rated capacity Refrigerants 10% equipment costs non-ozone depleting or r-123 for twp years.
HelpfulResources • US Dept of Energy: www.eere.energy.gov • US Green Building Council: www.usgbc.org • US Energy star program: www.energystar.gov • Sustainable Buildings Industry Council: www.sbicouncil.org • Sustainable building sources: www.greenbuilder.com • US EPA Environmental building specifications: www.epa.gov/
In United States, buildings account for: 36% of total energy use 65% of electricity consumption 30% of greenhouse gas emissions 30% of raw materials use 30% of waste output/136 million tons annually 12% of potable water consumption Environmental benefits: Enhance and protect ecosystems and biodiversity Improve air and water quality Reduce solid waste Conserve natural resources Economic benefits: Reduce operating costs Enhance asset value and profits Improve employee productivity and satisfaction Optimize life-cycle economic performance Health and community benefits: Improve air, thermal and acoustic environments Enhance occupant comfort and health Minimize strain on local infrastructure Contribute to overall quality of life Why build green? Did you know?
Water Efficiency • Water efficient landscape • Innovative wastewater technologies • Water use reduction • The US discharges 220 billion gallons of used water and/or treated water per day into rivers streams and water bodies. LEED
Vegetated Roofs • Control Storm Water • Protect roof membrane • Eliminate Heat Island effect • Insulates building • Actively Cools building in Summer • Creates O2 and Absorbs CO2
Styles are sorted into these broad categories: Conventional Rounded Earth-sheltered Styles of green homes
Conventional Styles Contemporary and Traditional • Contemporary styling • modern appearance, Unusual architectural lines, Use of newer materials. • Traditional styling • Typical styles: Early American, Craftsman, Ranch, and French.
Rounded Styles • Four Types • Curved • Curved Floor Plan • Domed • Curved floor plan with dome roof. • Vault • Straight walls, curved or domed roof only. • Faceted, • Octagonal floor plan giving round feel Faceted
Earth-Sheltered Styles • Three Types • Berm • Living Roofs • Earthships
Materials • Earth • Wood • Straw • Stone • Manufactured • Lightweight Concrete
Earth as a Building Material • Four types • Adobe • Cobb • Rammed Earth • Earthbag
Wood as a Building Material • Log • Timber frame • Stick Frame • CordWood
Manufactured Building Materials • Several Types • Autoclaved Aerated Concrete (AAC) • Insulated Concrete Forms (ICF’S) • Structural Insulated panels (SIP’S) • Shotcrete….Steel
Lightweight Concrete • Two Types • Pumicecrete • Papercrete
Insulate Windows Low-E, low-conductivity frames, double/triple glaze Renewable/ Solar Energy Natural cooling, passive solar heating, solar water heating Use low or No VOC Paint & finishes Use recycled or rapidly renewing resources bamboo, cork, ceramic tile from recycled glass Energy Star appliances Install CFL’s Insulate hot/cold water pipes flow reducers in showers/faucets Incorporate fly ash in foundation Permeable paving, design around existing landscape, natural water catchments Orient homes on East-west axis for solar access Other Things We Can do
Carpool Drive Green Other Things We Can Do Reduce heating -cooling usage Replace Furnace Filters Reduce Electrical Usage Check Tire Pressure Install CFL’s