Download
1 / 27
270 likes | 350 Vues
Explore the uneven distribution and consequences of teacher pension benefits enhancements in Missouri during the 1990s. Discover the implications for experienced and young teachers, socioeconomic and school disparities, and potential long-term costs.

E N D
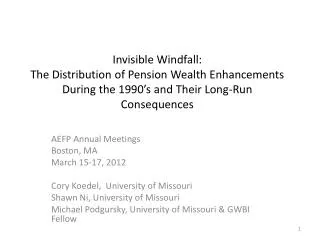
Invisible Windfall:The Distribution of Pension Wealth Enhancements During the 1990’s and Their Long-Run Consequences AEFP Annual Meetings Boston, MA March 15-17, 2012 Cory Koedel, University of Missouri Shawn Ni, University of Missouri Michael Podgursky, University of Missouri & GWBI Fellow
Invisible Windfall • Like many other states, Missouri enacted large enhancements to teacher pension benefits during 1990’s • Little analysis of the effects of these enhancements in any state • Large windfall ($2.4b) and very unequally distributed. • Experienced teachers had large windfall gains. Net benefits for young teachers much smaller and possibly negative. • Benefits favored higher SES and low minority schools • Peculiar structure of gains and elastic behavioral response of teachers likely to make ultimate costs much larger than anticipated (“peak value” to “peak plateau”) • Teacher quality effects probably small and possibly negative
Invisible Windfall • Like many other states, Missouri enacted large enhancements to teacher pension benefits during 1990’s • Little analysis of the effects of these enhancements in any state • Large windfall ($2.4b) and very unequally distributed. • Experienced teachers had large windfall gains. Net benefits for young teachers much smaller and possibly negative. • Benefits favored higher SES and low minority schools • Peculiar structure of gains and elastic behavioral response of teachers likely to make ultimate costs much larger than anticipated (“peak value” to “peak plateau”) • Teacher quality effects probably small and possibly negative
Key Enhancements Table 1. Key Parameters of the Missouri Pension System, 1995 – 2002 (there were no changes after 2002). Initial Parameters as of 1995 are Reported in Row 1.
Final Average Salary DB pensions: Educators in public schools in the United States are nearly universally enrolled in defined benefit pension plans. Most plans are administered at the state level and share a common structure. The following formula is used to determine the annual benefit: F = formula factor, YOS = years of service, FAS = final average salary Note: Missouri teachers (PSRS) are not covered by Social Security
Pension Wealth For each teacher the present discounted value (PDV) of pension wealth at time s, with collection starting at time j where j ≥ s, can be calculated as: Real interest rate = 4%, Inflation Rate = 3% Salary growth modeled on MO data
Life Cycle Pension Wealth Accrual for Typical Teacher: 1995 Rules
Table 2. Summary of Pension-Enhancement Effects in Missouri. Counterfactual Pension Wealth Computed Using 1995 Pension Parameters. 2009 Dollars.
Table 2. Summary of Pension-Enhancement Effects in Missouri. Counterfactual Pension Wealth Computed Using 1995 Pension Parameters. 2009 Dollars.
Table 2. Summary of Pension-Enhancement Effects in Missouri. Counterfactual Pension Wealth Computed Using 1995 Pension Parameters. 2009 Dollars.
Table 2. Summary of Pension-Enhancement Effects in Missouri. Counterfactual Pension Wealth Computed Using 1995 Pension Parameters. 2009 Dollars.
Table 3. Distribution of Enhancement-Driven Gains in Expected Pension Wealth Across the 2009 Teaching Workforce. Gains are Relative to Baseline Expected Pension Wealth Using the System Parameters and Exit Rates from the Pre-Enhancement Period. 2009 Dollars.
Table 6. Relation between Enhancement-Driven Gains in Expected Pension-Wealth and Teachers’ Schooling Environments in 2009.
Entering teachers probably worse off Table 5. Projected Total Pension Wealth for a New Teacher in 2012 under Different Pension Regimes and Contribution Scenarios.
Conditional Distribution of Experience for Teachers Exiting With 20-40 Years Experience
Experience and Age of Teacher Retirees: 1993, 2002, and 2007 (Missouri )