Download

1 / 27
270 likes | 458 Vues
A iming Higher A State Scorecard on Health System Performance. Cathy Schoen Senior Vice President The Commonwealth Fund Alliance for Health Reform June 15, 2007 On behalf of Rutgers University Center for State Health Policy and Commonwealth Fund Co-Authors www.commonwealthfund.org.

E N D
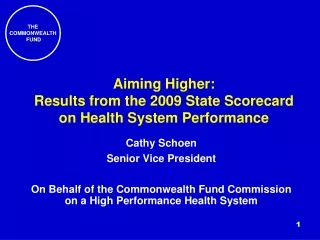
Aiming HigherA State Scorecard on Health System Performance Cathy Schoen Senior Vice President The Commonwealth Fund Alliance for Health Reform June 15, 2007 On behalf of Rutgers University Center for State Health Policy and Commonwealth Fund Co-Authors www.commonwealthfund.org
Purpose and Methods • Aims to stimulate discussion, collaboration, and policy action • Modeled on National Scorecard • 5 dimensions: access, quality, avoidable hospital use and costs, equity, and healthy lives • Contrasts to highest performers • Ranks states on indicators and dimensions • 32 indicators • Dimension rank = average of indicator ranks • Overall rank = average of dimension ranks • Equity • Gaps for vulnerable group (income, insurance, race/ethnicity) on subset of 11 indicators
Aiming Higher: Key Findings • Wide variation among states, huge potential to improve • Two to three-fold differences in many indicators • Leaders offer benchmarks • Leading states consistently out-perform lagging states • Suggests policies and systems linked to better performance • Distinct regional patterns, but also exceptions • Access and quality highly correlated across states • Significant opportunities to address cost, quality, access • Quality not associated with higher cost across states • All states have room to improve • Even best states perform poorly on some indicators
Gains to Nation if All States Achieved Top State Performance • More People Covered • 22 million additional adults and children insured • More Getting the Right Care • Nearly 9 million additional adults (50+) and 4 million diabetics would receive recommended care • 750,000 children immunized • More Getting Primary Care • 22 million adults and 10 million children with primary care • Less Avoidable Hospital Utilization • More than 1 million fewer Medicare hospital admissions and readmissions per year (Savings of $5 billion+ per year) • Costs • $22 billion annual Medicare savings if high cost states came down to average • Healthy Lives • 90,000 fewer premature deaths
QUALITY • Getting the Right Care • Coordinated Care • Patient-Centered Care
QUALITY: THE RIGHT CARE State Variation: Ambulatory Care Quality Indicators Percent DATA: Adult preventive care – 2002/2004 BRFSS; Adult diabetic preventive care – 2002/2004 BRFSS; Child vaccines – 2005 National Immunization Survey; Child medical and dental visits – 2003 National Survey of Children’s Health SOURCE: Commonwealth Fund State Scorecard on Health System Performance, 2007
QUALITY: THE RIGHT CARE (3 indicators) (5 indicators) (2 indicators) State Variation: Hospital Care Quality Indicators, 2004 Percent of patients who received recommended care DATA: 2004 CMS Hospital Compare SOURCE: Commonwealth Fund State Scorecard on Health System Performance, 2007
QUALITY: THE RIGHT CARE State Variation: Surgical Infection Prevention, 2005 Percent of adult surgical patients who received appropriate timing of antibiotics to prevent infections* * Comprised of two indicators: before and after surgery. DATA: 2005 CMS Hospital Compare SOURCE: Commonwealth Fund State Scorecard on Health System Performance, 2007
QUALITY: COORDINATED CARE State Variation: Coordination of Care Indicators Percent DATA: Adult usual source of care – 2002/2004 BRFSS; Child medical home – 2003 National Survey of Children’s Health; Heart failure discharge instructions – 2004-2005 CMS Hospital Compare SOURCE: Commonwealth Fund State Scorecard on Health System Performance, 2007
AVOIDABLE HOSPITAL USE AND COSTS State Variation: Hospital Admissions Indicators Percent DATA: Medicare readmissions – 2003 Medicare SAF 5% Inpatient Data; Nursing home admission and readmissions – 2000 Medicare enrollment records and MedPAR file; Home health admissions – 2004 Outcome and Assessment Information Set SOURCE: Commonwealth Fund State Scorecard on Health System Performance, 2007
EQUITY • Based on gaps between most vulnerable to national average • Low-income (below 100% or 200% of poverty) • Uninsured • Racial, ethnic minority
EQUITY Lack of Recommended Preventive Care by Income and Insurance Percent of adults age 50+ who did not receive recommended preventive care By income By insurance Note: Top 5 states refer to states with smallest gap between national average and low income/uninsured. Bottom 5 states refer to states with largest gap between national average and low income/uninsured. DATA: 2002/2004 BRFSS SOURCE: Commonwealth Fund State Scorecard on Health System Performance, 2007
HEALTHY LIVES Mortality Amenable to Health Care by Race, National Average and State Variation Deaths* per 100,000 Population Overall U.S. Average = 103 deaths per 100,000 *Age-standardized deaths before age 75 from select causes; includes ischemic heart disease Note: Top 5 states refer to states with smallest gap between national average and black. Bottom 5 states refer to states with largest gap between national average and black. DATA: Analysis of 2002 CDC Multiple Cause-of-Death data files using Nolte and McKee methodology, BMJ 2003. SOURCE: Commonwealth Fund State Scorecard on Health System Performance, 2007
Aiming Higher Urgent need for action that takes a whole-system population perspective and addresses access, quality and efficiency • Universal coverage with meaningful access: foundation for quality and efficient care • Wide variations point to opportunities to learn • Information systems and better information are critical for improvement • National leadership and public and private collaborative improvement initiatives
Acknowledgments:Rutgers University Center for State Health Policy and The Commonwealth Fund Co-Authors Joel C. Cantor, ScD Director, Rutgers University Center for State Health Policy Dina Belloff, MA Senior Research Analyst, Rutgers University Center for State Health Policy Douglas McCarthy, MBA Senior Research Advisor, The Commonwealth Fund Sabrina How, MPA Research Associate, The Commonwealth Fund
Related Commission Reports • Why Not the Best? Results from a National Scorecard on U.S. Health System Performance (Sept. 2006). The Commonwealth Fund Commission on a High Performance Health System. • “U.S. Health System Performance: A National Scorecard” (Sept. 20, 2006). C. Schoen, K. Davis, S. K. H. How, and S. C. Schoenbaum. Health Affairs Web Exclusive. • The Agency for Healthcare Research and Quality's 2006 National Healthcare Quality Report (March 2007). S. C. Schoenbaum, D. McCarthy, and C. Schoen. • Public Views on Shaping the Future of the U.S. Health System (August 2006). C. Schoen, S. K. H. How, I. Weinbaum, J. E. Craig, Jr., and K. Davis. • Framework for a High Performance Health System for the United States (August 2006). The Commonwealth Fund Commission on a High Performance Health System. For these and other Commonwealth Fund Reports visit the Fund website: www.commonwealthfund.org