Download
1 / 17
170 likes | 323 Vues
Impact of interannual atmospheric forcing on the Mediterranean Outflow Water variability in the Atlantic Ocean . Alexandra Bozec 1 , Eric Chassignet 1 , Susan Lozier 2 In collaboration with George Halliwell 3 , and Zulema Garraffo 4.

E N D
Impact of interannual atmospheric forcing on the Mediterranean Outflow Water variability in the Atlantic Ocean Alexandra Bozec1, Eric Chassignet1, Susan Lozier2 In collaboration with George Halliwell3, and Zulema Garraffo4 1Center for Ocean-Atmospheric Prediction Studies, Tallahassee, FL 2 Division of Earth and Ocean Sciences, Duke University, Duke, NC 3 Atlantic Oceanographic and Meteorological Laboratory, Miami, FL 4 Rosenstiel School of Marine and Atmospheric Science, Miami, FL
Background • Trends in water properties of the Mediterranean Outflow Water reservoir (Potter and Lozier, 2004): • Observations: • Max of S of each profiles • Time period : 1955 to 1993 • 3 year moving average • Results: TEMPERATURE SALINITY PRESSURE DENSITY 1955 1995
Source of Variability for the MOW Reservoir Mediterranean Sea Water (MSW) North Atlantic Central Water (NACW) • Change in MOW properties through either MSW and/or NACW properties • Change in the Atlantic circulation Mediterranean Outflow Water (MOW)
Mediterranean Sea Water variability Mediterranean Sea Water from E-P • Lozier and Sindlinger (2009) • Derived MSW salinity using different E-P products (NCEP/NCAR, ECMWF, DaSilva) • NCEP/NCAR Med Sea Water: • S-Trend: +0.037 ± 0.018 psu/decade • Resulting MOW reservoir salinity (assuming NACW constant in the MSBC): • S-Trend:+0.0024 ± 0.0014psu/decade • => 10 times lower than observations NCEP/NCAR ECMWF DaSilva
NACW entrained variability From HydroBase 2 NACW trends between 1955-1993: Trend S at 550m: -0.0063±0.0035 psu/dec. Trend T at 550m: -0.0198±0.0108 ºC/dec.
MOW variability in the Observations • We use the MSBC (Price and Yang, 1998) to calculated the MOW trend at the exit of Cadiz: • MSW averaged of the 150-600m layer in the Mediterranean Sea (Rixen et al. 2005). • Observed NACW properties at 550m. • MOW trend in the reservoir: • S-Trend: -0.0058±0.0022 psu/decade
The variability of the Mediterranean Sea water and of the North Atlantic Central water are too weak to be responsible for the variability of the MOW in the Atlantic. • Hypothesis: The variability is due to the interannual variability of the atmosphere (wind and/or buoyancy forcing).
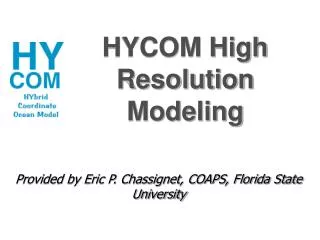
Experimental Set-up • 3 simulations using 1/3º Atlantic HYCOM with the Marginal Sea Boundary Condition (Price and Yang, 1998). • Spin-up of 30 years • 60 years simulations • Constant properties of the MSBC MOW: • T=11ºC, S=36.2psu,Transport =4Sv.
MOW Reservoir Trends in HYCOM REF WIND BUOY+WIND
Spreading of the MOW • We compare the MOW tongue (s2=36.52) during 1955-1970 and 1980-1995 for each simulation: REF WIND BUOY+WIND
Why is the MOW tongue expanding? • The cross section at 36ºN shows tilted isopycnals in BUOY+WIND compared with the other simulations.
Time Evolution of Interface Depths REF MOW Salinity (psu) • MOW salinity increase coincides with a retraction of the Labrador Sea Water (LSW) from the Central Atlantic. 500m Interface depths (m) 2500m 1950 2006
LSW thickness (s2=36.83) NAO-/+ NAO- NAO- NAO- NAO-/+ NAO-/+ NAO+ NAO+ NAO+ NAO-/+ NAO-/+ Salinity contour (white): 35.15psu, 35.2psu and 35.3psu
Trend reversal in the 2000s From Leadbetter et al., 2007
Conclusions • We are able to reproduce the MOW reservoir variability in the Atlantic for a constant MOW production. • The observed MOW reservoir variability is due to circulation changes in the Atlantic Ocean induced by the atmospheric forcing. • These circulation changes are primarily due to the variability in buoyancy forcing through the formation and flushing of Labrador Sea Water during low and high NAO periods. • We can identify a 20-year cycle in phase with the NAO for the period 1950-2005. (i.e. time needed to fill and empty the “LSW reservoir”).
In the Observations HYDROBASE
Price and Yang Box model • The Price and Yang model (Price and Yang, 1998) • Mediterranean Surf. Fluxes areprescribed and CONSTANT • E-P-Rover Mediterranean • QNet Heat flux over Mediterranean • Depth of the entrained water • The Atlantic Ocean Water Properties are given by HYCOM • T1,S1, r1of Gibraltar inflow water • Tent, Sent, rentof entrained interior water at • shelf-slope break • P-Y ModelOutput • Gibraltar outflowrgib, Sgib, Tgib • Entrained interior water transport • Final product waterrmow, Smow, Tmow, depth, transport E-P-R Q T1,r1,S1 Tgib,rgib,Sgib Tent, Sent, rent Tmow, rmow,Smow