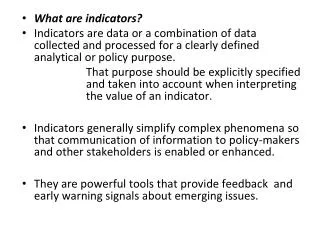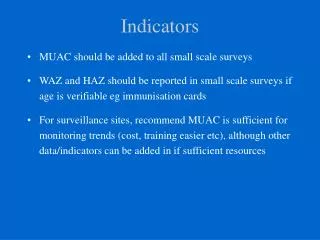
Indicators are Powerful
Genuine Progress Index for Atlantic Canada Indice de progrès véritable - Atlantique Measuring Community Wellbeing Measuring What Matters Dundee, Scotland 27 March, 2009. Indicators are Powerful. What we measure: reflects what we value as a society;

Indicators are Powerful
E N D
Presentation Transcript
Genuine Progress Index for Atlantic CanadaIndice de progrès véritable - AtlantiqueMeasuring Community WellbeingMeasuring What MattersDundee, Scotland27 March, 2009
Indicators are Powerful What we measure: • reflects what we value as a society; • determines what makes it onto the policy agenda (e.g volunteers); • influences behaviour (students): & What we don’t count doesn’t get attention
Counting it Wrong • Resource depletion as economic gain • Negatives can make economy grow • Unpaid work counts for nothing • How much income/wealth but not how it’s distributed -> Misleading signals to policy makers and general public (e.g. GHGs)
A good set of indicators can help communities: • foster common vision and purpose; • identify strengths and weaknesses; • hold leaders accountable at election time • evaluate which programs are working or not • initiate actions to promote wellbeing; + agreed targets can change public behaviour
Therefore – In the GPI: • Natural wealth, health, free time, unpaid work, and education have value • Sickness, crime, disasters, pollution are costs • Reductions in greenhouse gas, crime, poverty, ecological footprint are progress • Growing equity signals progress GPI Atlantic = Non-profit, fully independent, NS-based research and education organization founded April,1997. Web site: www.gpiatlantic.org
Provincial -> Community • Where rubber hits road in QOL; BUT Statcan data not available at comm. level • Kings County, Glace Bay – Contrasting communities - Consultations, survey design • 2+ hours; Sample size = 3,600 (2 cross-tabs – 95% +/- 3%); Statcan oversight • Response rate = 70+% Kings; 82% GB
Basic GPI question: What kind of community are we leaving our children...?
Survey components include: • Economic wellbeing – including income, employment and job characteristics • Subjective wellbeing: life satisfaction, happiness • Core values and guiding life principles • Social supports and networks, formal and informal volunteering, and care-giving • Health status, incl. self-reported health, chronic disease prevalence, activity limitations, and prevention (e.g. mammograms, blood pressure tests)
Lifestyle behaviours, incl. smoking, diet, physical activity • Mental health, including cognitive ability, stress, and depression • Children’s health, including health status, mental health, cognition, and chronic conditions • Environmental behaviours (e.g. transportation patterns) and ecological attitudes • Safety and security, including victimization rates and subjective feelings of safety.
Each category has several indicators (results in charts) E.g. employment section will have results on: • Unemployment (short + long-term) • part-time employment • work schedules • job characteristics • multiple job holding • discouraged workers • proportion of jobs with employee benefits
Health Status and Income Query: If health status is income related and Glace Bay has a much higher proportion of low income respondents, why isn’t GB self-rated health status lower than Kings? • Higher rates VG/excellent health across most income groups in Glace Bay • As a result, overall rates are equivalent despite the higher rates of low income in Glace Bay and relationship between health and income. But why…..?
Faith, spirituality, safety… • Glace Bay had higher rates of self-reported faith, spirituality, church attendance, decision control + half as likely to have been victimized or to know someone who has been victimized In Sum: GB low stress, high faith, safety, social supports = non-material assets that partially compensate for poorer material conditions = key sources of life satisfaction & wellbeing + important information for community development planners (vs conventional tools)
Value Alienation? • Large majority of respondents in both communities believe they are socially motivated individuals living in a materialistic society • Is dominant commercial culture, materialism out of touch with what matters most to people? • Factor analysis: Positive social values intrinsically related to positive wellbeing while materialistic values were not - Consistent with growing research literature
Practical utility for policy. E.g: • Glace Bay has significantly higher current smoke rate but lower ever-smoked rate = Quit rate much higher in Kings County -> Schools initiative • Identify health needs, prevention/screening: E.g. Kings significantly higher rates than GB for mammogram (64% vs 40%), CBE (45% vs 35%). Both low on Pap smear (47% vs 45%)
Results suggest new policy options% workers willing to trade all or part of a future pay increase for shorter work hours
Greater focus on economic security vs consumption • E.g. Core values: 3x high importance to financial security vs material wealth • So policies that enhance job security, ensure living wage, social safety net appear closer to values than growth policies alone • E.g. Benefits: Part-time workers less than half as likely to have most benefits + very strong relationship with income. E.g. GB: less than 5% lowest income have benefits. Cf Netherlands
Ecological Attitudes and Behaviours • 83% said their way of life produces too much waste, & focuses too much on current consumption, not enough on conserving resources for future generations • 85% said “most of us” buy and consume more than we need; 2/3 said they could consume less if they chose • Stronger in Kings and among high-income (81% could consume less)
And at most practical level: • E.g: Kings: Volunteerism: 49% would give more time if asked: Esp: males - 55%; low income – 58% ; young (15 to 24) 76% • E.g: Glace Bay: Identified problem areas - police chief immediate action At the community level, fewer barriers to action. Power of evidence - can really inform practical decisions
+ Process = Result. E.g.: • Indicator selection, creating survey = community building • Farmers exchanging information • Report releases in Sheffield Mills, Jeddore - farmers, fishermen present • New ideas: e.g. restorative justice • Results bring disparate groups together Next Step…. Update
To sum up so far:……..What do we measure? = Step 1 • What matters? – Community consultations on vision, goals = ownership • 2 questions: (a) What kind of Dundee, do we want to leave our children (10, 20, 50 years); (b) Are we better off today than we were at our children’s age? • Universal vs partisan values, vision, goals + unique to culture, place -> specific indicators (vs vague, general) • Participant circumstances, use of measures
Step 2 = How: (a) Data collection, survey instruments • Random sample methods – stratification, sample size (statistical validity), cross-tabs. • Construct survey instrument, test (ambiguity and meaningful results), data entry (e.g. GB = community training), data cleaning, data analysis. Transparency on data limitations • Use of qualitative research (e.g. focus groups) and local wisdom
BUT – are indicators enough? Why go beyond indicators? • Danger of social and environmental indicators as “add-ons”: The side streets and the highway • GDP is not an indicator, but an accounting system. To challenge its power and dominance, we must enter the world of economic valuation • New measures must critique GDP-based ones
Till we take aim at perverse messages of existing accounting system, nothing will change • A/c GDP-based accounting: The more fossil fuels we burn, more trees we cut, the better off we are • Losses out of sight, out of mind: Local farms, cod, forests, voluntary work, free time (unmeasured) • Current consensus on “injection” of “fiscal stimulus” to spur spending and growth. By contrast, recession, reduced consumption = R & R for natural world – dare we say it?!
Indicators & Accounts: Need both! • Indicators assess progress – based on physical measures (eg trends - crime rates, GHG emissions). • Accounts assess value: • Balance sheets, stocks = assets and liabilities • Flows = what we earn and spend, including costs of economic activity, crime, GHG emissions • GDP assesses market flows, treats social and environmental costs/benefits as “externalities.”
Accounting/valuation examples: • Trends in volunteerism = indicator. Volunteer work contributes $1.8 billion to NS economy = accounts • Crime costs NS $700 million + / year • Smoking costs NS health care $171 million / year • Stern (WB-UK): Compared GHG control costs (1% global GDP) with climate change damage costs (5%-20% global GDP). Concluded: "The benefits of strong, early action on climate change outweigh the costs.”
The Capital Accounting Model • To assess nation’s true wealth, need to measure the value of natural, human, social, cultural, built, and financial capital. • Only the latter two are currently valued but all capital is subject to depreciation and requires periodic re-investment. E.g. forests, health, crime, language, voluntary decline (vs car sector bailout) • The good news – we are able to measure and even quantify aspects of the other capitals
The Good News: What Portion is Preventable? • 40% chronic disease incidence • 50% chronic disease mortality • 25% medical care costs • 38% total burden of disease Are attributable to modifiable risk factors = $500 million / year preventable in N.S.
Examples of policy impacts: • NS voluntary work worth $1.8 billion/year • Preventable chronic disease costs NS $500m in excess health care costs –> DHPP • Costs tobacco, obesity, inactivity –> e.g. HRM planning process; smoke-free legislation • Full CBAs – e.g. Solid Waste; Halifax Harbour cleanup; HRM transportation
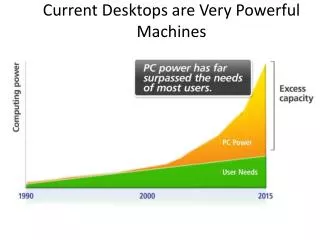
Predictive power of new accounts Early warning vs “I told you so” (vs ‘expert’ bank head analysis)
Fishery GDP for Nova Scotia, 1984-1999(1997$ millions): Depletion of Natural Wealth as Economic Gain
Total Farm Cash Receipts, NS, 1971–2007 (Millions of $2007) = no early warning
Total Farm Operating Expenses, NS & PEI, 1971–2006(Millions of $2007)
Expense to Income Ratio (%), Nova Scotia Farms, 1971–2006
Total Net Farm Income, Nova Scotia, 1971–2007 (millions of $2007)
Total Net Farm Income and Total Debt, NS Farms, 1971-2006 (millions of $2007)
Caveat: New GPI accounts do not seek to replace GDP • … But replace the misuse of GDP as a measure of progress, wellbeing, and prosperity: Cite Kuznets warnings on proper use of GDP – what is growing • Anything can make economic grow, incl. depletion of natural wealth + activities that signify decline in wellbeing, prosperity (e.g. crime, crashes, pollution) • Quantitative measure of size cannot assess quality of life, though GDP will always have role in assessing size of market economy – less important
Economic valuation: Full-Cost Accounting - 3 basic principles: • Internalize ‘externalities’ (e.g. GHG emissions) • Recognize economic value of non-market assets (e.g. voluntary sector, natural capital) • Fixed -> variable costs (e.g. car registration, insurance a/c km driven) $ values - strategic only = inadequacy of $ as valuation instrument. “Value” = larger
Full-Cost Accounting Results • Overall full cost of N.S. road transportation system in 2002: $6.4 billion - $13.3 billion • True cost is about $7,598/capita, of which $4,562 are “invisible” costs • Fixed and external costs account for over2/3 of total cost • These results indicate an inefficient, unsustainable transportation system where externalities conceal the full costs to society
Conventional Accounting Results • Implementing Solid Waste-Resource Strategy led to an increase in operating and amortized costs from $48.6 million ($53/capita) in 1996 to $72.5 million ($77/capita) in 2001 • Increased cost of $24 million ($25/capita) for implementing the changes • Conventional accounts stop there
Material Energy savings Paper 8.5 million Btu Plastic 20.1 million Btu Glass 2.4 million Btu Steel Cans 18.4 million Btu Aluminium Cans 166.9 million Btu Energy savings per tonne of waste recycled