Motivation
USING META-ANALYSIS TO EXPLAIN VARIATION IN HEAD START RESEARCH RESULTS: THE ROLE OF RESEARCH DESIGN. Hilary M. Shager, Holly S. Schindler, Cassandra M. D. Hart, Greg J. Duncan, Katherine A. Magnuson, and Hirokazu Yoshikawa SREE Annual Research Conference March 4, 2010. Motivation.


Motivation
E N D
Presentation Transcript
USING META-ANALYSIS TO EXPLAIN VARIATION IN HEAD START RESEARCH RESULTS:THE ROLE OF RESEARCH DESIGN Hilary M. Shager, Holly S. Schindler, Cassandra M. D. Hart, Greg J. Duncan, Katherine A. Magnuson, and Hirokazu Yoshikawa SREE Annual Research Conference March 4, 2010
Motivation • Difficult to compare findings across studies in early childhood education • Problem of comparing “apples to oranges” in terms of research designs • Great variation in method, quality, and results • How can we use Head Start research as an example to understand the importance of research design in explaining variation in results? • Comprehensive, federally funded early education program for economically disadvantaged children • In operation since 1965
Previous literature • Head Start meta-analysis (McKey et al., 1985) • Lack of comparison group yields larger ES • More general meta-analyses of early ed programs • Camilli et al., 2008 • High quality design composite associated with larger ES • Gorey, 2001 • No link between ES and index of study internal validity • Nelson et al., 2003 • No link between ES and total methodology score or individual study characteristics
Research question & hypotheses • What role do research design factors play in explaining variation in Head Start evaluation results? (Focus on cognitive and achievement outcomes)
Method: meta-analysis • What is meta-analysis? • Method of quantitative research synthesis using prior study results as the unit of observation • Estimates transformed into common metric (ES), expressed as a fraction of a standard deviation • Results from individual studies can then be used to estimate the average ES across studies • Additionally, meta-analysis can be used to test whether average ES differs by characteristics of studies • Team of coders across 3 universities • Extensive training and reliability tests
Step 1: literature search • Important to identify all Head Start evaluations (published & unpublished) • Search years: 1965-2007
Step 2: screening • Screening criteria • Must have a comparison group • At least 10 participants in each condition • < 50% attrition • Experimental or quasi-experimental with one of following designs: • Regression discontinuity • Fixed effects (individual or family) • Difference-in-difference • Instrumental variables • Propensity score matching • Interrupted time series • Use of pretest as control • Demonstrated comparability of groups at baseline
Additional criteria for this paper • Eliminate alternative treatment or curricular add-on studies • Retain studies in which control group participants seek services of their own volition • Measure at least 1 cognitive or achievement outcome • Timing of outcome measure • Outcomes measured after at least 75% of treatment received • Outcomes measured 12 or fewer months post-treatment
What’s left? • Resulting # of included reports = 53 • 24 Head Start studies • 19 studies conducted in the 1960s • 9 Summer Head Start studies • 4 experimental • Includes National Head Start Impact Study (1st year findings)
Step 3: creating database (coding) • Nested structure of data • 239 effect sizes within 33 contrasts • Contrast=comparison of one group of Head Start participants to another group who did not receive Head Start • Dependent measure=ES • Standard deviation unit difference in outcome between children who experienced Head Start and those who did not • Hedges’ g • ES estimated using Comprehensive Meta-Analysis (CMA) software
Measures: program & study characteristics • Modern Head Start program • Post 1974 (when quality guidelines implemented) • Length of treatment • Months, re-centered at 2 months • Published in peer refereed journal • Versus unpublished reports & dissertations, as well as book chapters
Measures: design characteristics • Activity level of control group • Passive (ref. group) • Active= some control group members experienced other early education services • Missing • Type of research design • Randomized controlled trial (ref. group) • Quasi-experimental • Design changed post-hoc (originally randomized) • Baseline covariates included in analysis • Bias • Count of additional forms of bias noted by coders
Measures: dependent measure characteristics • Type of measure • Performance test (ref. group) • Rating by someone else • Observational rating • Domain • Cognitive skills not sensitive to instruction (ref. group) • IQ, attention, vocabulary, theory of mind • Academic skills sensitive to instruction • Reading, math, letter recognition, numeracy • Timing of outcome measure • Months post-program (range= -2.5 to 12)
Attrition & reliability • Attrition (always less than 50%) • Low attrition = Quartile 1 & 2 (<16%) (ref. group) • Medium attrition = Quartile 3 (16-25%) • High attrition =Quartile 4 (>25%) • Missing attrition = missing info on overall attrition • Reliability • High reliability = Quartile 4 (>.93) (ref. group) • Medium reliability = Quartile 2 & 3 (.66-.93) • Low reliability = Quartile 1 (<.66) • Missing reliability = missing coefficient
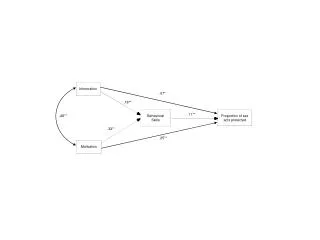
Analytic model • Multivariate, multi-level approach Level 1 (effect size) model: ESij = β0i + β1ix1ij + … + βkixkij + eij Level 2 (contrast) model: β0i = β0 + ui • Enter all covariates at once • ES weighted by inverse variance of estimate • Intercept (empty model) = .18
Results: attrition t=p<.10; *=p<.05; **=p<.001
Results: dependent measure characteristics reference group: performance test
Robustness checks • Generally, findings remain robust • Include missing effect sizes (N=20) • Unweighted • Take out National Impact Study • Include year of program start
What did we learn? • Research design matters • Activity level of control group • Reliability & type of dependent measure • Baseline covariates • But some things we thought might matter did not • Randomized vs. quasi-experimental • Time between intervention and outcome measure • Attrition • Bottom line: we can’t simply compare across research studies, even from the same program
Limitations and future work • Limitations • 24 studies, 53 reports • Missing information & measurement error • Future work • Look at long-term outcomes • Look at treatment vs. alternative treatment contrasts • Extend to include other early childhood education studies
Acknowledgements • National Forum on Early Childhood Policy and Programs, Center on the Developing Child, Harvard University • Funders for the Forum: • The Birth to Five Policy Alliance, the Buffett Early Childhood Fund, the McCormick Tribune Foundation, the Norlien Foundation, and an Anonymous Donor • Coders at Harvard, UW-Madison, and UCI: • Todd Grindal, Jocelyn Bowne, JenyaMurnikov, Soojin Susan Oh, Robert Kelchen, Jimmy Leak, and Weilin Li • The rest of the meta-analysis team at Harvard & Johns Hopkins: • Lenin Grajo, Avika Dixit, Sandra Tang, Sai Ma, Alyssa Crawford, AsantewaGyekye, Elizabeth Harrison, and Tara Laboda • Shager’s work on this project was also supported by the Institute of Education Sciences, U.S. Department of Education, through Award #R305C050055 to the University of Wisconsin-Madison. The opinions expressed are those of the authors and do not represent views of the U.S. Department of Education.