Download
1 / 13
130 likes | 288 Vues
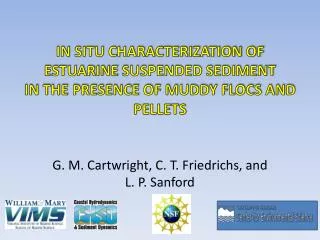
IN SITU CHARACTERIZATION OF ESTUARINE SUSPENDED SEDIMENT IN THE PRESENCE OF MUDDY FLOCS AND PELLETS. G. M. Cartwright, C. T. Friedrichs , and L. P. Sanford. W s α D . λ. Turbulence. Fugate and Friedrichs (2003). Fecal Pellets. Sand. Flocculants. Mud. D ~ O( λ )

E N D
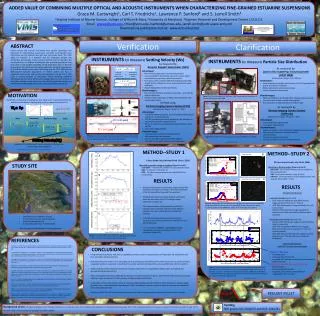
IN SITU CHARACTERIZATION OF ESTUARINE SUSPENDED SEDIMENT IN THE PRESENCE OF MUDDY FLOCS AND PELLETS G. M. Cartwright, C. T. Friedrichs, and L. P. Sanford
Wsα D λ Turbulence Fugate and Friedrichs(2003) Fecal Pellets Sand Flocculants Mud D ~ O(λ) Microflocs < 160 µm Macroflocs >160 µm Ws D~ 5 – 10 µm Ws< to <<0.1 mm/sec D= 63 – 500 µm Ws = 2.3–60 mm/s D~ 10s – 100s µm Ws Ws ~0.1–10 mm/s λ % Organic λ Settling Velocity Anderson (2001), Sanford et al (2005) Sherwood (2007) Taghon et al (1984), Wheatcroft et al (2005)
Wsα D λ Turbulence Fugate and Friedrichs(2003) Fecal Pellets Sand Flocculants Mud D ~ O(λ) Microflocs < 160 µm Macroflocs >160 µm Ws D~ 5 – 10 µm Ws< to <<0.1 mm/sec D= 63 – 500 µm Ws = 2.3–60 mm/s D~ 10s – 100s µm Ws Ws ~0.1–10 mm/s λ % Organic λ Settling Velocity Anderson (2001), Sanford et al (2005) Sherwood (2007) Taghon et al (1984), Wheatcroft et al (2005)
NSF MUltiDisiplinaryBenthic Exchange Dynamics Claybank area on York River Chesapeake Bay, VA Micro tidal ( 0.7 to 1 meter) STUDY SITE Secondary Channel ~ 5 meter depth Neap Tide Seabed > 75% mud ~10% Organics Sand D50 ~100 µm <30% Pellets Kraatz, (2010, personal comm), Rodriguez-Calderon (2010)
25 hour Study Period LISST 100X 15 min burst interval 100 records @ 1 Hz (10 samples/record) Distribution measured 2.5 – 500 µm RipsCam 1 hour “burst” interval 5 flash exposures at 1 min interval Focal depth ~1mm Distribution measured ~60 µm – 1.3 mm ADV 15 min burst interval 2 min @ 10 Hz METHOD CTD S2E LISST ADV Real-time Communication Cables RipsCam
Currents, Stress and Concentration A Concentration by weight(mg/L) corresponds with peak currents B Concentration by volume (µm/L) doesn’t C D
EXAMPLE DISTRIBUTIONS Slack after Ebb Dominant Floc size ~315 µm Increasing stress toward Ebb
EXAMPLE DISTRIBUTIONS Slack after Ebb Increasing stress toward Ebb Dominant Pellet size ~102 µm
EXAMPLE DISTRIBUTIONS Slack after Ebb Increasing stress toward Ebb Dominant Floc size ~205 µm
Low Stress Dominate floc size ~ 315 µm LISST Peak LISST D84 RIPScam D50 High Stress Pellets ~ 102 µm LISST Peak LISST D50 RIPScam D16 Dominate floc size ~ 205 µm LISST D84 RIPScam Peak RIPScam D50 STUDY PERIOD DISTRIBUTIONS µl/L slack EBB slack Flood slack Ebb slack Flood slack
Settling Velocity and Volume Concentration Pellets Increase stress Increase eff. Ws Increase volconc slack EBB slack Flood slack Ebb slack Flood slack Flocs Decrease stress Decrease eff. Ws Increase volconc
Conclusionsand Future work • The LISST can be used to identify different suspended sediment populations • LISST Peakgrainsize or D84 during maximum stress is the dominant resilient grainsize • LISST Peak grainsize or D50 during slack periods is the dominant flocculent size (larger will occur but at levels that are averaged out during burst averaging) • LISST D50 during maximum stress represents the dominant minimum flocculent size • Future work needs to look at LISST distributions during spring tide and episodic events to discover how the higher stress change the sizes and populations in suspension • Calibrations, with the Total Suspended Solids broken into resilient and non resilient portions, needs to be done to convert volume concentration to mass concentration so the density of the dominant particles can be determined • Time averaged burst statistics can be used to determine the effective fall velocity of the sediment in suspension • Once the mass concentration of the dominant particles are identified further work can be done to calculate effective fall velocity of these size classes.
Acknowledgements Students, Vessel and Lab personnel At UMCES and VIMS Specifically: Tim Gass Wayne Reisner Steve Suttles Kim Yong Emily Miller Lindsey Kraatz Kelsey Fall Carissa Wilkerson