Download
1 / 15
150 likes | 182 Vues
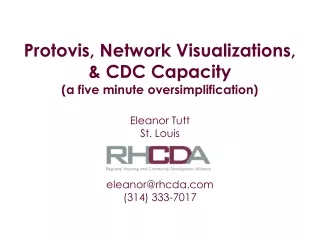
Protovis, Network Visualizations, & CDC Capacity (a five minute oversimplification) Eleanor Tutt St. Louis eleanor@rhcda.com (314) 333-7017. One Aspect of Capacity: Networks. A CDC with increased capacity has increased ability to: Utilize resources Connect with opportunities

E N D
Protovis, Network Visualizations, & CDC Capacity(a five minute oversimplification)Eleanor TuttSt. Louiseleanor@rhcda.com(314) 333-7017
One Aspect of Capacity: Networks • A CDC with increased capacity has increased ability to: • Utilize resources • Connect with opportunities • Forge partnerships • Tackle large problems • Can network visualizations help tell the capacity building story in a compelling way? Protovis, Network Visualizations, & CDC CapacityOakland NNIP Meeting, October 2010
Protovis: The Visualization Toolkit • Graphical toolkit designed for web-native visualizations*** • Led by Stanford Visualization Group • Uses JavaScript and SVG • Free and Open Source (BSD License) • Designed to be learned by example • http://vis.stanford.edu/protovis/ Protovis, Network Visualizations, & CDC CapacityOakland NNIP Meeting, October 2010
Protovis: The Visualization Toolkit • Graphical toolkit designed for web-native visualizations*** • Led by Stanford Visualization Group • Uses JavaScript and SVG • Free and Open Source (BSD License) • Designed to be learned by example • http://vis.stanford.edu/protovis/ Protovis, Network Visualizations, & CDC CapacityOakland NNIP Meeting, October 2010
Protovis “Force-Directed Layout” Capability • What we need: • Protovis (download from website) • Data about Organizations and Connections • .html page with Protovis script Protovis, Network Visualizations, & CDC CapacityOakland NNIP Meeting, October 2010
Data in Array Form Protovis, Network Visualizations, & CDC CapacityOakland NNIP Meeting, October 2010
.html Page Protovis, Network Visualizations, & CDC CapacityOakland NNIP Meeting, October 2010
Protovis Script Protovis, Network Visualizations, & CDC CapacityOakland NNIP Meeting, October 2010
Protovis Script Protovis, Network Visualizations, & CDC CapacityOakland NNIP Meeting, October 2010
Result: ONSLRG Network in 2000 Protovis, Network Visualizations, & CDC CapacityOakland NNIP Meeting, October 2010
Result: ONSLRG Network in 2000 Protovis, Network Visualizations, & CDC CapacityOakland NNIP Meeting, October 2010
Result: ONSLRG Network in 2010 Protovis, Network Visualizations, & CDC CapacityOakland NNIP Meeting, October 2010
Issues with Current Visualizations • Ego-centric approach = not whole picture • Organizations vs. Individuals • Difficulty looking backward in time • What counts as a connection? • Somewhat biased approach Protovis, Network Visualizations, & CDC CapacityOakland NNIP Meeting, October 2010
Ideas for Further Work • Collect information on complete networks • Neighborhood-based (everyone working in ONSL) • Topic-based (everyone connected to food security) • Quality baseline data for 2010 • More formal survey process? • Focus on problem solving/inspiring action • Are there missed opportunities for connections? Protovis, Network Visualizations, & CDC CapacityOakland NNIP Meeting, October 2010
Ideas for Further Work • Collect information on complete networks • Neighborhood-based (everyone working in ONSL) • Topic-based (everyone connected to food security) • Quality baseline data for 2010 • More formal survey process? • Focus on problem solving/inspiring action • Are there missed opportunities for connections? Protovis, Network Visualizations, & CDC CapacityOakland NNIP Meeting, October 2010